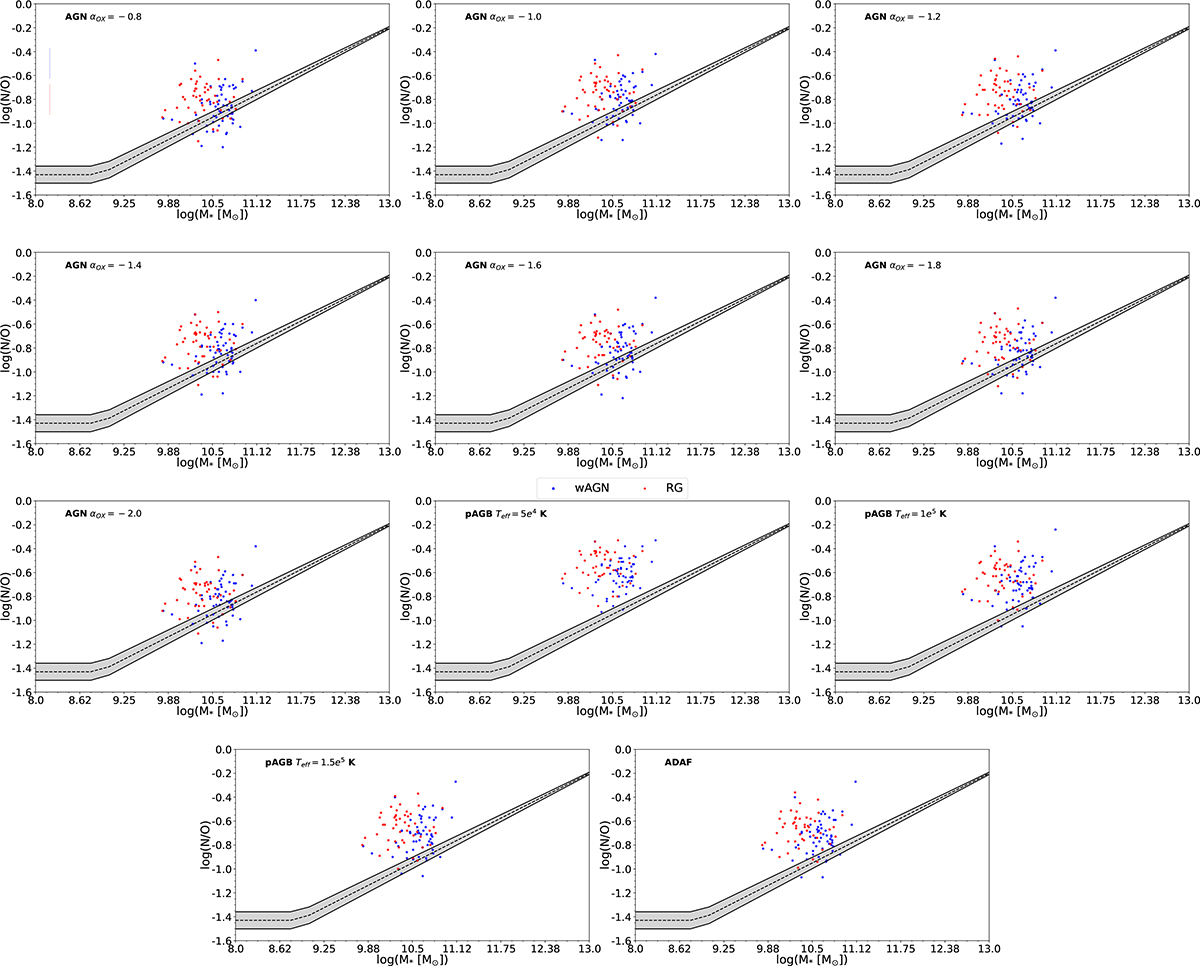
Fig. 7.
Download original image
Mass-NO relation based on the metallicity determinations in the nuclear regions of our sample of LINERs for different grids of photoionization models. The first plot shows the typical errors for the data. The dashed line represents the fit from Andrews & Martini (2013), and the gray shaded area shows the corresponding uncertainty on the relation.
Current usage metrics show cumulative count of Article Views (full-text article views including HTML views, PDF and ePub downloads, according to the available data) and Abstracts Views on Vision4Press platform.
Data correspond to usage on the plateform after 2015. The current usage metrics is available 48-96 hours after online publication and is updated daily on week days.
Initial download of the metrics may take a while.