Fig. 5.
Download original image
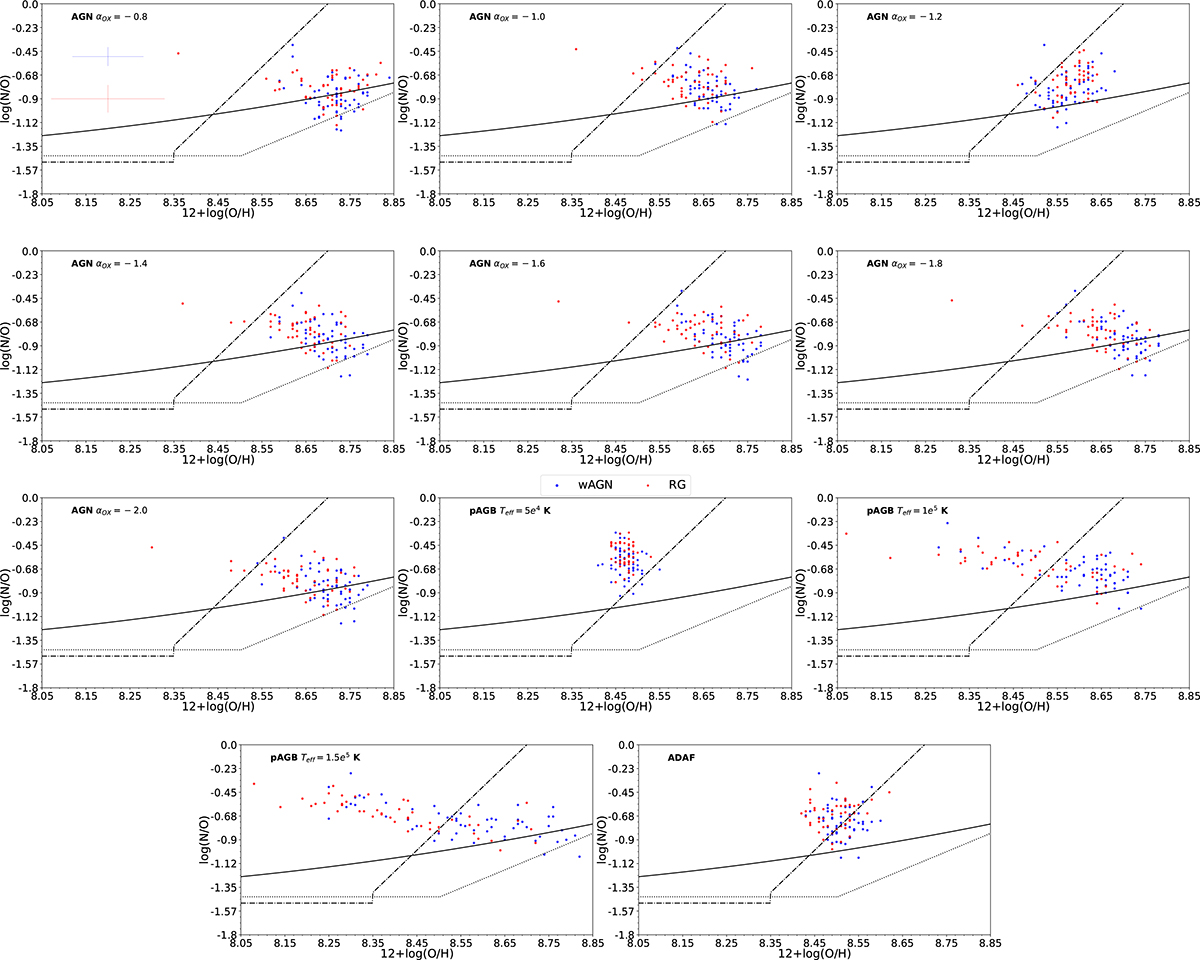
Relation of the nuclear estimations of log(N/O) and 12+log(O/H) in our sample of LINERs for each grid of photoionization models. The first plot shows the typical errors for the data. The solid back line represents the fit provided by Coziol et al. (1999), the dotted line shows the fit by Andrews & Martini (2013), and the dash-dotted line shows the fit by Belfiore et al. (2015).
Current usage metrics show cumulative count of Article Views (full-text article views including HTML views, PDF and ePub downloads, according to the available data) and Abstracts Views on Vision4Press platform.
Data correspond to usage on the plateform after 2015. The current usage metrics is available 48-96 hours after online publication and is updated daily on week days.
Initial download of the metrics may take a while.