Fig. 2.
Download original image
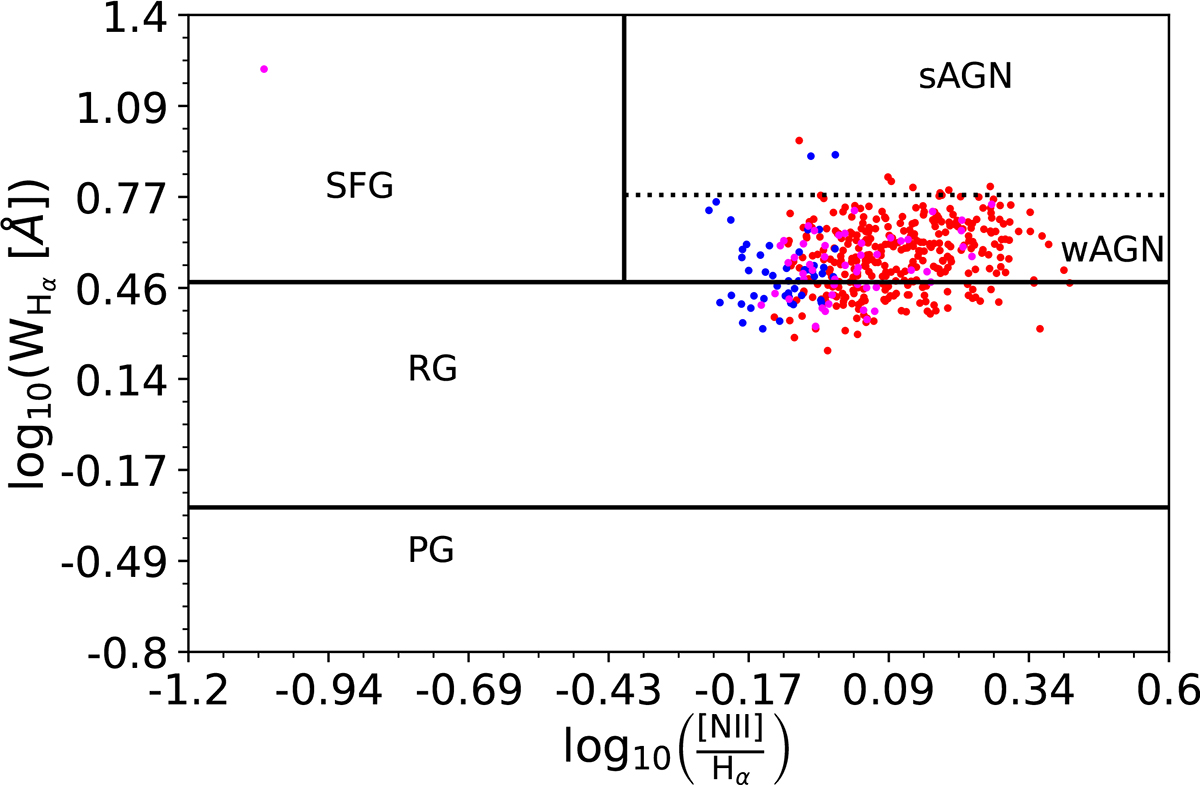
WHAN diagram, showing the region demarcations as provided by Cid Fernandes et al. (2010, 2011). The color code represents the classification as given by the BPT diagrams (see Figure 1): Red dots represent galaxies classified as LINERs, blue dots represent galaxies falling in the composite region, and magenta dots show galaxies without a clear classification. Each region is labeled as follows: SFG for star-forming galaxies, sAGN for strong AGNs, wAGN for weak AGNs, RG for retired galaxies, and PG for passive galaxies.
Current usage metrics show cumulative count of Article Views (full-text article views including HTML views, PDF and ePub downloads, according to the available data) and Abstracts Views on Vision4Press platform.
Data correspond to usage on the plateform after 2015. The current usage metrics is available 48-96 hours after online publication and is updated daily on week days.
Initial download of the metrics may take a while.