Fig. 10.
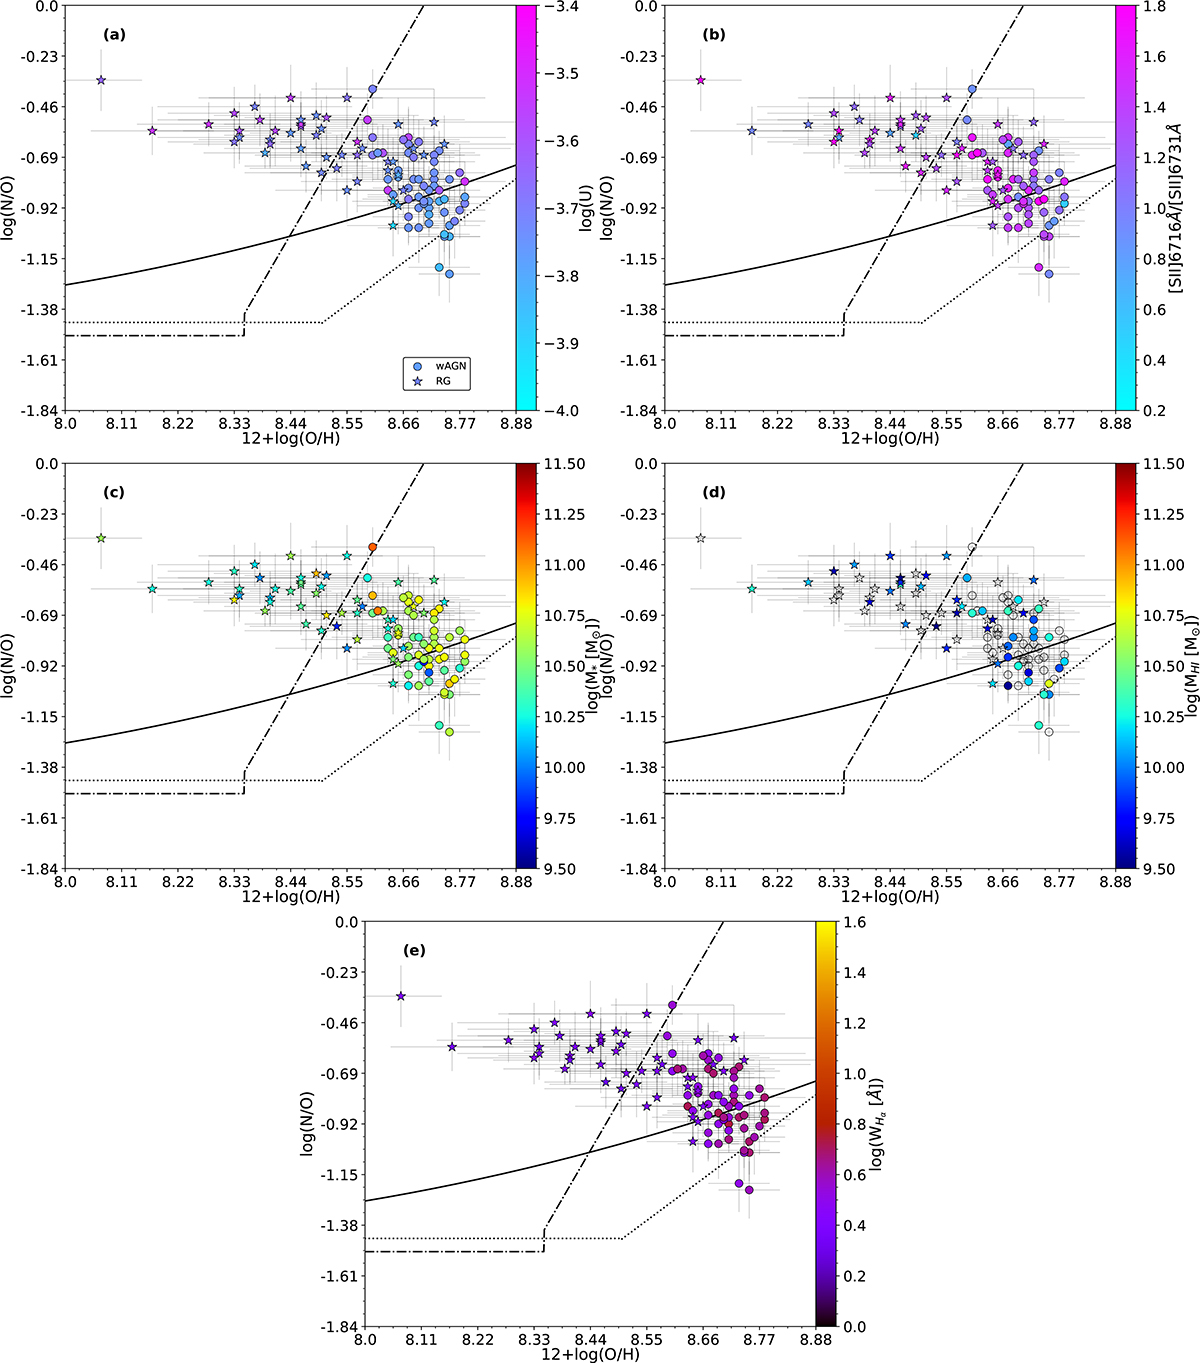
Download original image
log(N/O) vs. 12+log(O/H) diagram for our sample of LINERs. The dots represent galaxies classified as wAGN, and the chemical abundances correspond to AGN models with αOX = −1.6. The stars correspond to galaxies classified as RG whose chemical abundances were estimated assuming pAGB models with Teff = 1 ⋅ 105 K. The color bar shows different properties: (a) The ionization parameter as estimated from emission lines. (b) The sulfur ratio tracer of the electron density. (c) The stellar mass as retrieved from the NSA catalog. (d) The HI mass as retrieved from the NSA catalog. (e) The equivalent width of Hα. The empty symbols correspond to galaxies without a measurement of the represented property.
Current usage metrics show cumulative count of Article Views (full-text article views including HTML views, PDF and ePub downloads, according to the available data) and Abstracts Views on Vision4Press platform.
Data correspond to usage on the plateform after 2015. The current usage metrics is available 48-96 hours after online publication and is updated daily on week days.
Initial download of the metrics may take a while.