Fig. 1.
Download original image
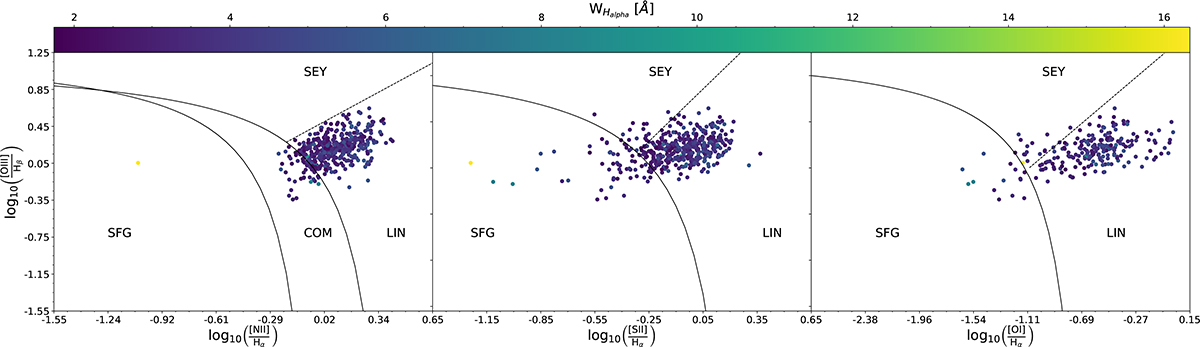
Diagnostic diagrams of the central spaxels in our sample of galaxies. The color bar shows the equivalent width for Hα (WHα). The solid and dashed lines represent the region limits as defined by Kewley et al. (2006), with the exception of the separation between Seyfert 2 and LINERs in the [NII]/Hα diagram, which was taken from Cid Fernandes et al. (2010). Each region is labeled as follows: SFG for star-forming galaxies, SEY for Seyferts, LIN for LINERs, and COM for composites.
Current usage metrics show cumulative count of Article Views (full-text article views including HTML views, PDF and ePub downloads, according to the available data) and Abstracts Views on Vision4Press platform.
Data correspond to usage on the plateform after 2015. The current usage metrics is available 48-96 hours after online publication and is updated daily on week days.
Initial download of the metrics may take a while.