Fig. C.1
Download original image
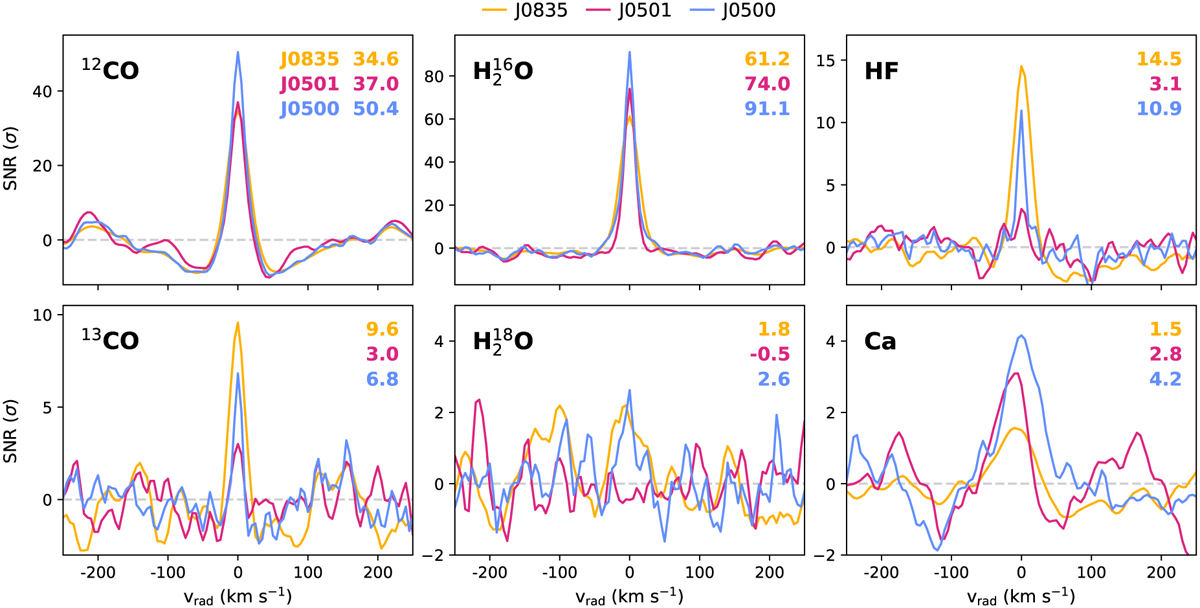
CCFs for 12CO, 13CO, ![]() ,
, ![]() , HF, and Ca abundances. The CCFs were calculated for each order–detector pair and summed over all orders and detectors, after which they were converted to S/Ns by dividing by the standard deviation of the CCFs in the range |vrad| > 100 km s−1. The different colours represent the different targets, J0835, J0501, and J0500. The peaks at vrad = 0 km s−1 are a result of the cross-correlation being performed on the observed spectrum centred in its rest frame. We indicate the peak S/N values in units of σ for each species and BD in the upper-right corner.
, HF, and Ca abundances. The CCFs were calculated for each order–detector pair and summed over all orders and detectors, after which they were converted to S/Ns by dividing by the standard deviation of the CCFs in the range |vrad| > 100 km s−1. The different colours represent the different targets, J0835, J0501, and J0500. The peaks at vrad = 0 km s−1 are a result of the cross-correlation being performed on the observed spectrum centred in its rest frame. We indicate the peak S/N values in units of σ for each species and BD in the upper-right corner.
Current usage metrics show cumulative count of Article Views (full-text article views including HTML views, PDF and ePub downloads, according to the available data) and Abstracts Views on Vision4Press platform.
Data correspond to usage on the plateform after 2015. The current usage metrics is available 48-96 hours after online publication and is updated daily on week days.
Initial download of the metrics may take a while.