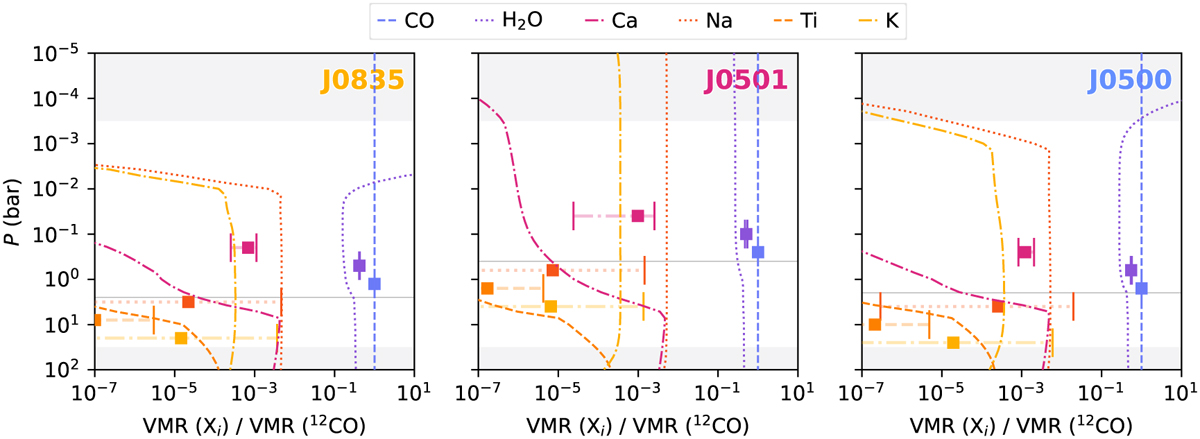
Fig. 6

Download original image
VMRs of line species (12CO, H2O, Ca, Na, Ti, and K) for the three BDs using the FC and EC method. The error bars represent the values retrieved with the FC method. The dashed lines show the Fastchem EC abundances corresponding to the best-fitting P-T profile, C/O ratio, and metallicity for each of the BDs. The EC abundances have a similar line style and colour as those of the associated FC VMR. The black lines indicate the location of the peak of the integrated contribution functions, and the shaded areas indicate the pressures where we expect large uncertainties as we are not sensitive to probe these atmospheric pressures.
Current usage metrics show cumulative count of Article Views (full-text article views including HTML views, PDF and ePub downloads, according to the available data) and Abstracts Views on Vision4Press platform.
Data correspond to usage on the plateform after 2015. The current usage metrics is available 48-96 hours after online publication and is updated daily on week days.
Initial download of the metrics may take a while.


