Fig. 3
Download original image
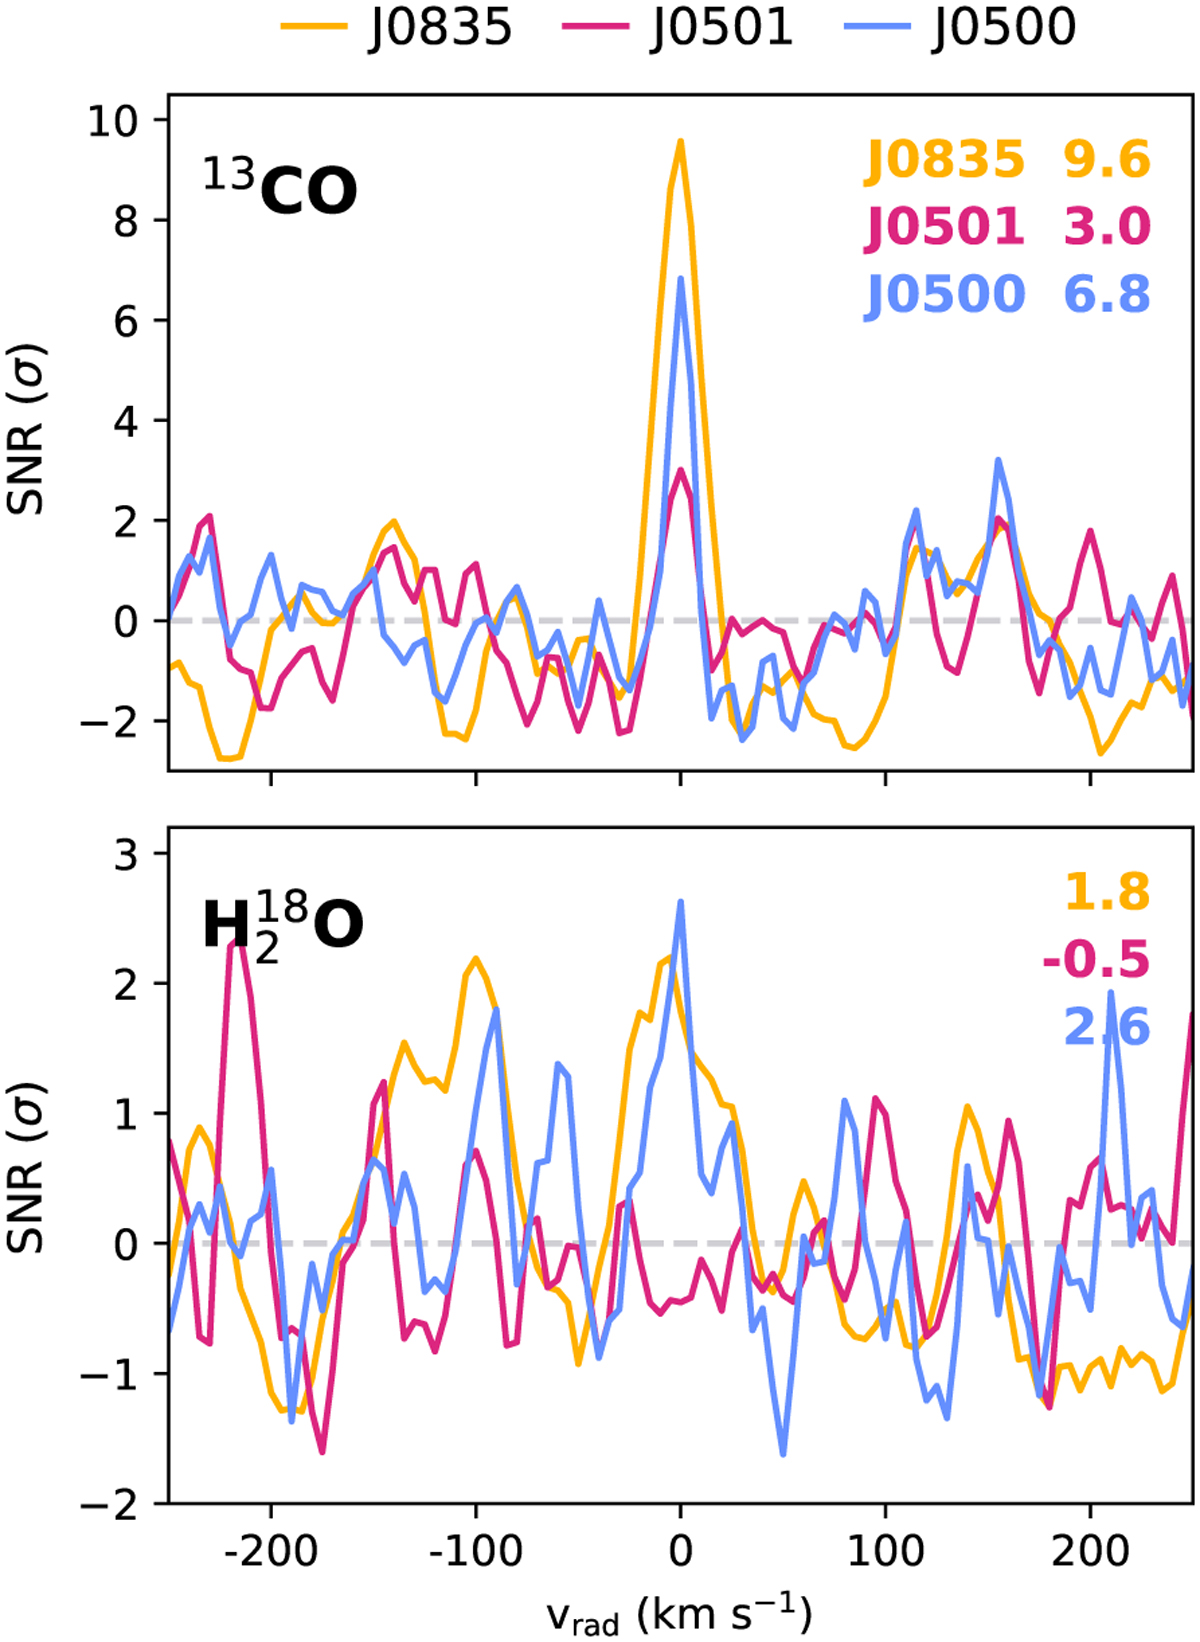
CCFs for 13CO and ![]() . The CCFs were calculated for each order–detector pair and summed over all orders and detectors, after which they were converted to S/N by dividing by the standard deviation of the CCFs away from the peak, excluding the values within −100 < vrad < 100 km s−1. The different colours represent the different targets, J0835, J0501, and J0500. The S/Ns of the peaks of the CCFs for each individual species are shown in the upper-right corner.
. The CCFs were calculated for each order–detector pair and summed over all orders and detectors, after which they were converted to S/N by dividing by the standard deviation of the CCFs away from the peak, excluding the values within −100 < vrad < 100 km s−1. The different colours represent the different targets, J0835, J0501, and J0500. The S/Ns of the peaks of the CCFs for each individual species are shown in the upper-right corner.
Current usage metrics show cumulative count of Article Views (full-text article views including HTML views, PDF and ePub downloads, according to the available data) and Abstracts Views on Vision4Press platform.
Data correspond to usage on the plateform after 2015. The current usage metrics is available 48-96 hours after online publication and is updated daily on week days.
Initial download of the metrics may take a while.