Fig. 2
Download original image
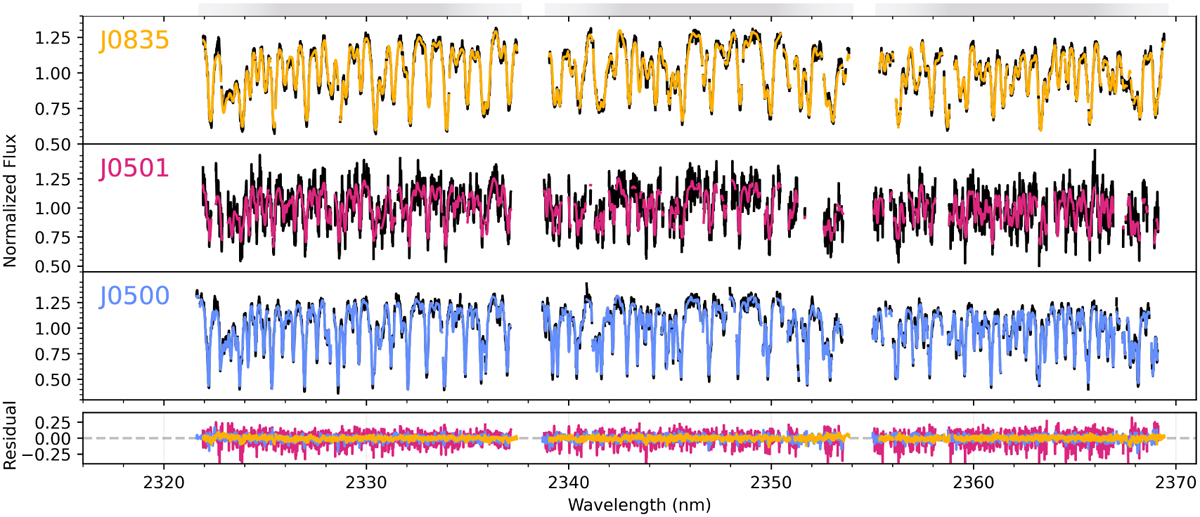
Best-fitting models retrieved for J0835, J0501, and J0500 (top to bottom). The upper three panels show the observational flux in black, and the best-fitting model spectra for the three BDs (J0835, J0501, and J0500). The observed flux is normalised to the mean flux of each order–detector pair after telluric correction. The lower panel shows the residuals between the observed and model spectra. The data and the models are displayed in the rest frame of each object. The shaded region at the top of the image indicates the wavelength coverage of the three detectors for each spectral order (CRIRES+ and K2166 wavelength setting). They slightly differ in the rest-frame of the BDs as presented by the gradient. The sixth order (2321.6-2369.6 nm) is shown because it contains several 12CO and 13CO lines. The data and best-fitting models of the remaining orders can be found in Appendix B.
Current usage metrics show cumulative count of Article Views (full-text article views including HTML views, PDF and ePub downloads, according to the available data) and Abstracts Views on Vision4Press platform.
Data correspond to usage on the plateform after 2015. The current usage metrics is available 48-96 hours after online publication and is updated daily on week days.
Initial download of the metrics may take a while.