Fig. 7
Download original image
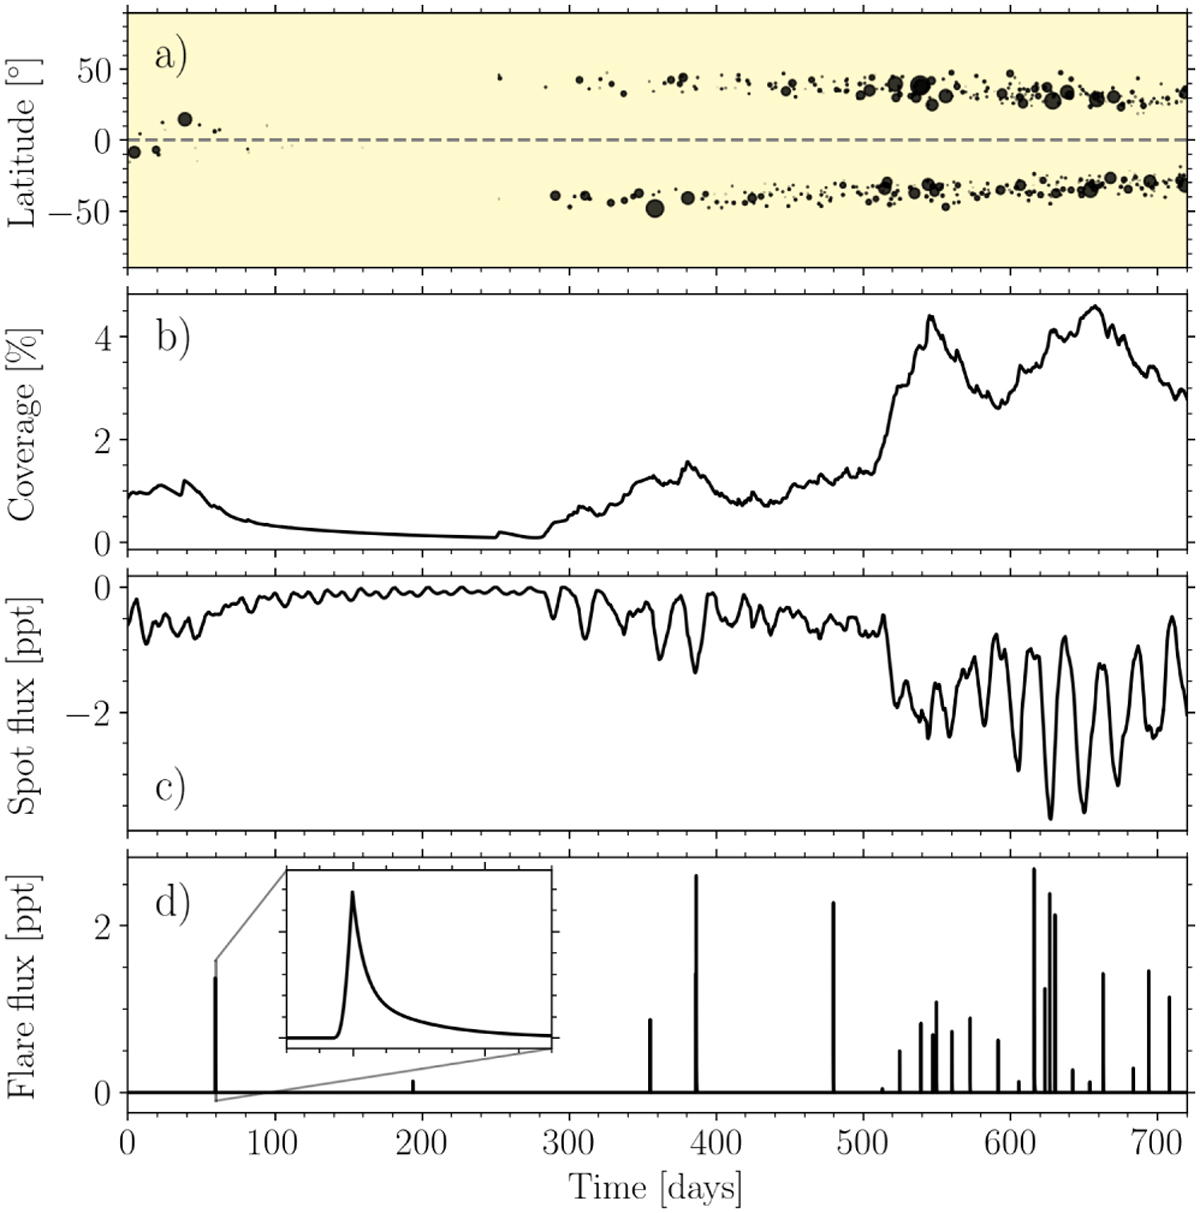
Illustration of a stellar on-axis activity model for a solar-like star simulated for two years. (a) Spot emergence diagram with the black dots being their latitudinal location and relative sizes at emergence with respect to the stellar surface. (b) Stellar surface area covered by spots (in percentage). (c) Relative flux darkening by the spot coverage (in ppt) as function time. (d) Relative flux brightening by stellar flares (in ppt) as function of time.
Current usage metrics show cumulative count of Article Views (full-text article views including HTML views, PDF and ePub downloads, according to the available data) and Abstracts Views on Vision4Press platform.
Data correspond to usage on the plateform after 2015. The current usage metrics is available 48-96 hours after online publication and is updated daily on week days.
Initial download of the metrics may take a while.