Fig. 6
Download original image
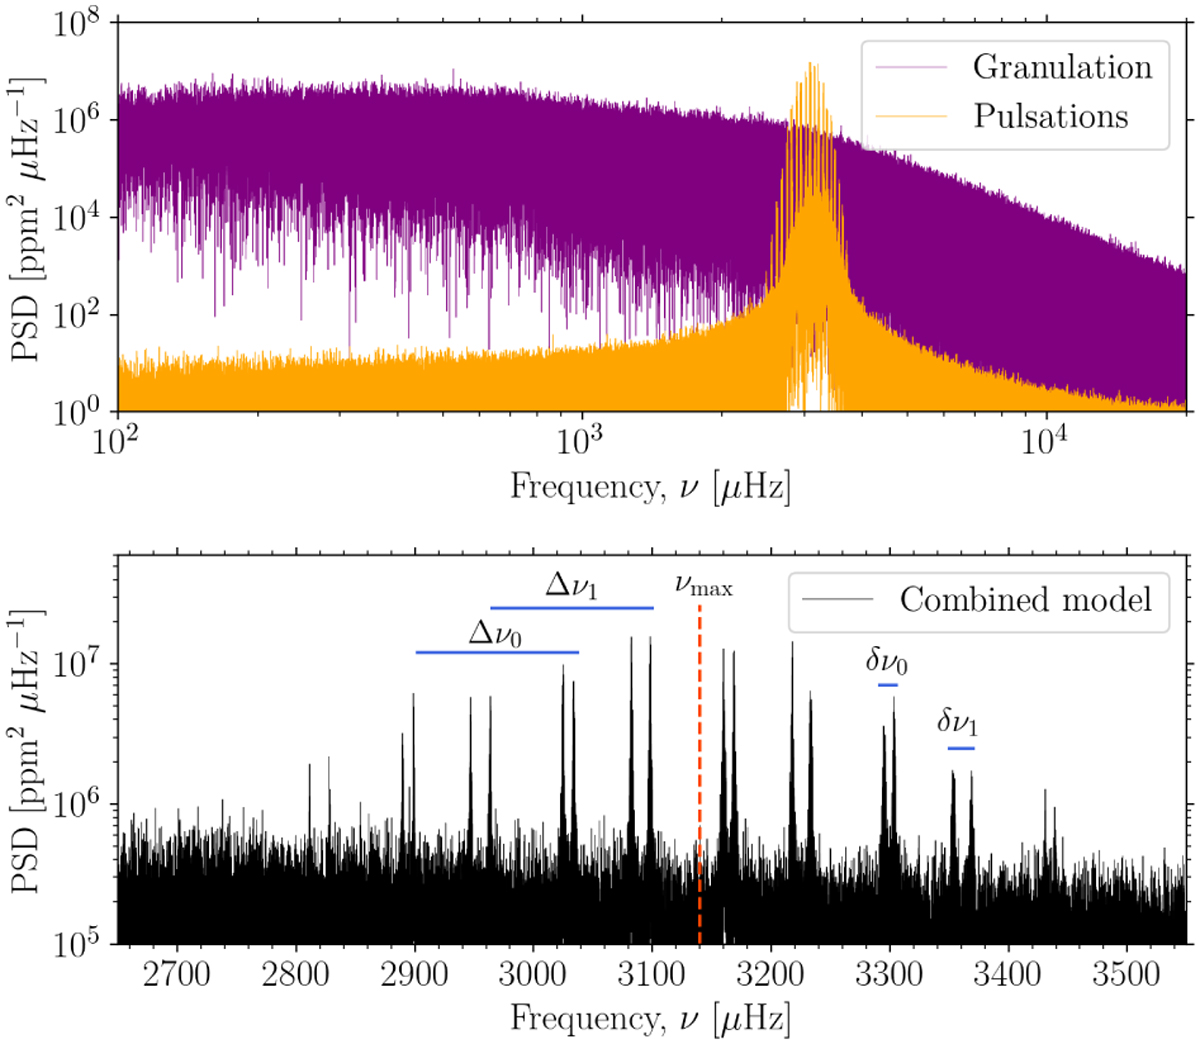
Power spectral density (PSD) diagrams showing granulation and pulsation signals caused by large convective envelopes in low-mass dwarfs. The PSD was computed for a 2-yr noise-less light curve. The bottom panel is a zoom-in on the combined model illustrating the standard envelope of excited modes (used to estimate the frequency of maximum power, νmax) and the small (δv) and large (Δv) frequency separations.
Current usage metrics show cumulative count of Article Views (full-text article views including HTML views, PDF and ePub downloads, according to the available data) and Abstracts Views on Vision4Press platform.
Data correspond to usage on the plateform after 2015. The current usage metrics is available 48-96 hours after online publication and is updated daily on week days.
Initial download of the metrics may take a while.