Fig. 5
Download original image
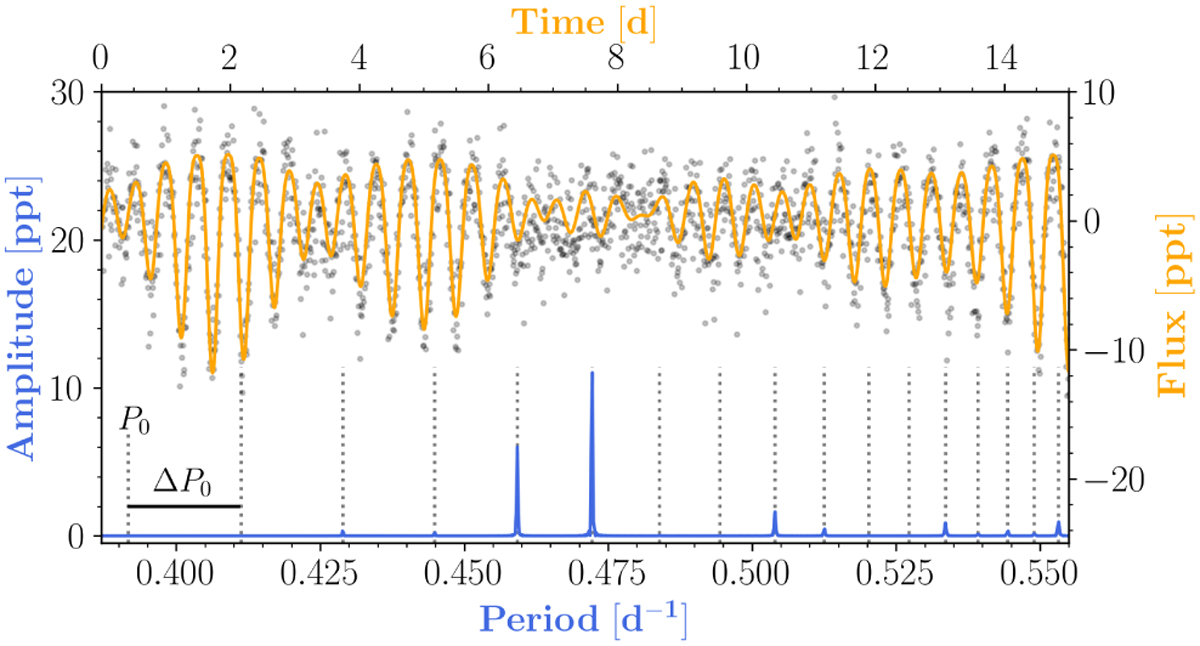
Example of a simulated SPB star. The lower/left axes belong to the amplitude spectrum (blue line), where we have highlighted the mode frequencies (dotted lines), the first mode period (P0), and the first period spacing (ΔP0). The upper/right axes belong to the corresponding light curve (shown for the first 15 days) in its noise-less form (orange line) and simulated form (black points, representing a 𝓟 ≈ 10.3 star observed with nCAM = 6).
Current usage metrics show cumulative count of Article Views (full-text article views including HTML views, PDF and ePub downloads, according to the available data) and Abstracts Views on Vision4Press platform.
Data correspond to usage on the plateform after 2015. The current usage metrics is available 48-96 hours after online publication and is updated daily on week days.
Initial download of the metrics may take a while.