Open Access
Fig. 4
Download original image
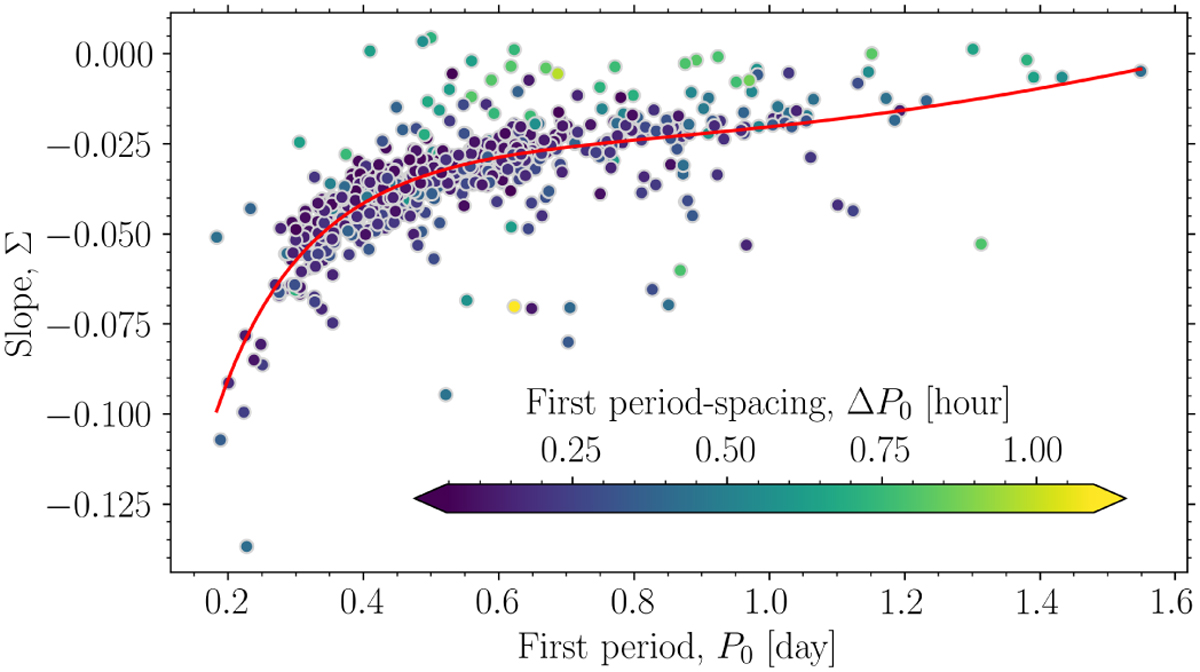
Model fit to the gradient–period relation for dipole sectoral prograde g modes from Li et al. (2020). Typically this diagram features the mean period, but here we correlate the first mode period in the period spacing pattern with the gradient. The colour scaling shows the value of the corresponding first period spacing.
Current usage metrics show cumulative count of Article Views (full-text article views including HTML views, PDF and ePub downloads, according to the available data) and Abstracts Views on Vision4Press platform.
Data correspond to usage on the plateform after 2015. The current usage metrics is available 48-96 hours after online publication and is updated daily on week days.
Initial download of the metrics may take a while.