Fig. 3
Download original image
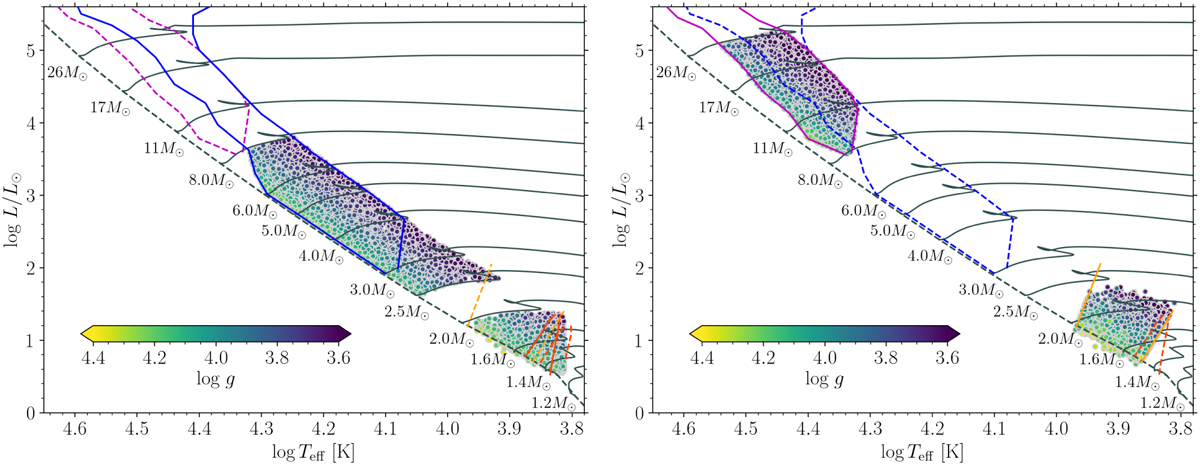
HRD of the γ Dor and SPB (left panel), and δ Sct and β Cep (right panel) stellar samples. The colour gradient indicates the stellar surface gravity, and over-plotted are MIST evolutionary tracks (Choi et al. 2016). Solid lines indicate instability strips for gravity modes in the left panel and pressure modes in the right panel. The red lines show the edges of the theoretical γ Dor instability strip from Dupret et al. (2005) (corresponding to a mixing length of respectively αMLT = 2 (solid lines) and αMLT = 1.5 (dashed lines) in the left-hand plot). The orange lines represent the observational δ Sct instability strip from Murphy et al. (2019). The blue and purple lines are the theoretical instability regions of SPB and β Cep stars, respectively, calculated by Burssens et al. (2020).
Current usage metrics show cumulative count of Article Views (full-text article views including HTML views, PDF and ePub downloads, according to the available data) and Abstracts Views on Vision4Press platform.
Data correspond to usage on the plateform after 2015. The current usage metrics is available 48-96 hours after online publication and is updated daily on week days.
Initial download of the metrics may take a while.