Fig. 19
Download original image
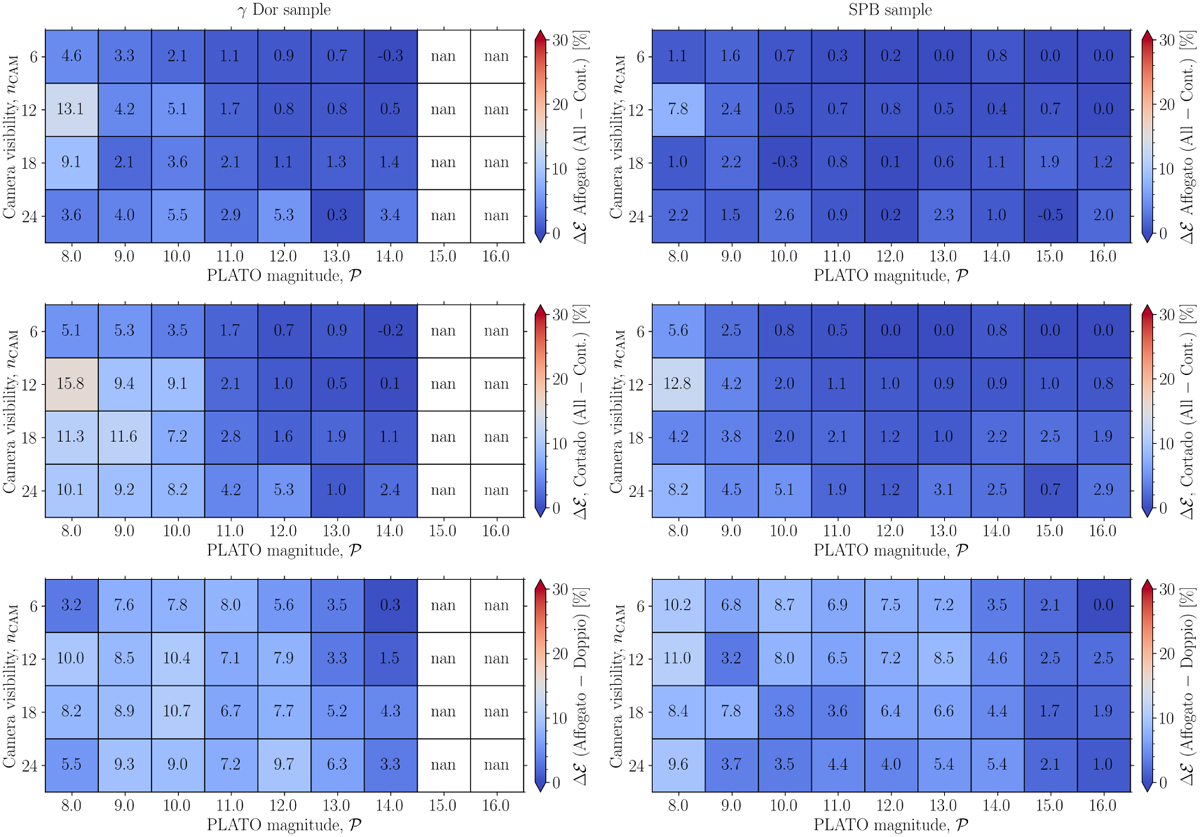
Detection efficiency residual (Δℰ in %) diagrams to test the impact of stellar contamination for the γ Dor sample (left panels) and SPB sample (right panels). The top panels show the results for non-variable targets from AFFOGATO when comparing all stars vs. contaminated stars only. The middle panels show the result for non-variable targets from CORTADO when comparing all stars vs. contaminated stars only. The lower panels show the result considering only contaminated targets and comparing non-variable targets of AFFOGATO vs. variable targets of DOPPIO. Note that the colour scaling of [0, 30] % was chosen in order to make a direct comparison to the Δℰ diagram of CORTADO displayed in the lower panels of Fig. 16.
Current usage metrics show cumulative count of Article Views (full-text article views including HTML views, PDF and ePub downloads, according to the available data) and Abstracts Views on Vision4Press platform.
Data correspond to usage on the plateform after 2015. The current usage metrics is available 48-96 hours after online publication and is updated daily on week days.
Initial download of the metrics may take a while.