Fig. 17
Download original image
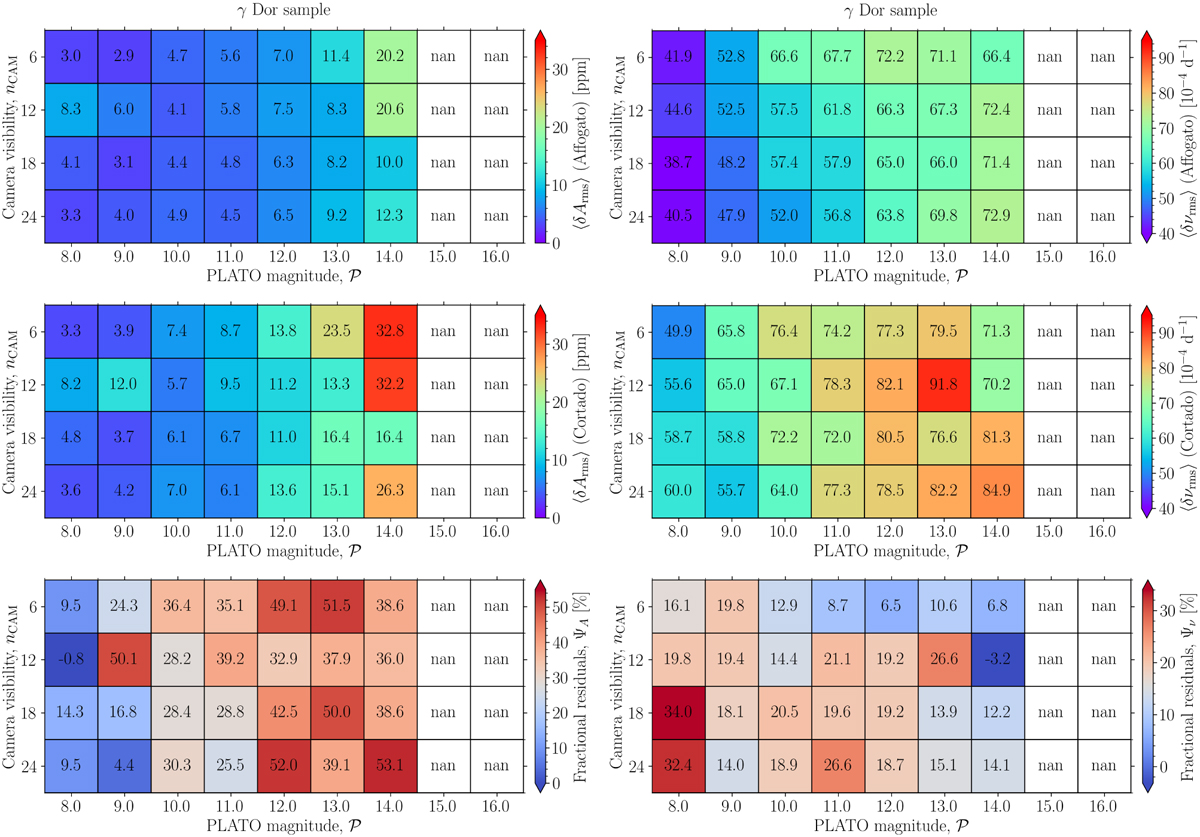
Amplitude precision (left panels; in ppm) and frequency precision (right panels; in d−1) of detected pulsation modes as a function of magnitude and camera visibility for the γ Dor sample. The top and middle panels show the results for AFFOGATO and CORTADO, respectively. The bottom panel shows the fractional residuals between the results of AFFOGATO and CORTADO. Note that compared to all other figures shown in this section, blue indicates the most desirable result.
Current usage metrics show cumulative count of Article Views (full-text article views including HTML views, PDF and ePub downloads, according to the available data) and Abstracts Views on Vision4Press platform.
Data correspond to usage on the plateform after 2015. The current usage metrics is available 48-96 hours after online publication and is updated daily on week days.
Initial download of the metrics may take a while.