Fig. 16
Download original image
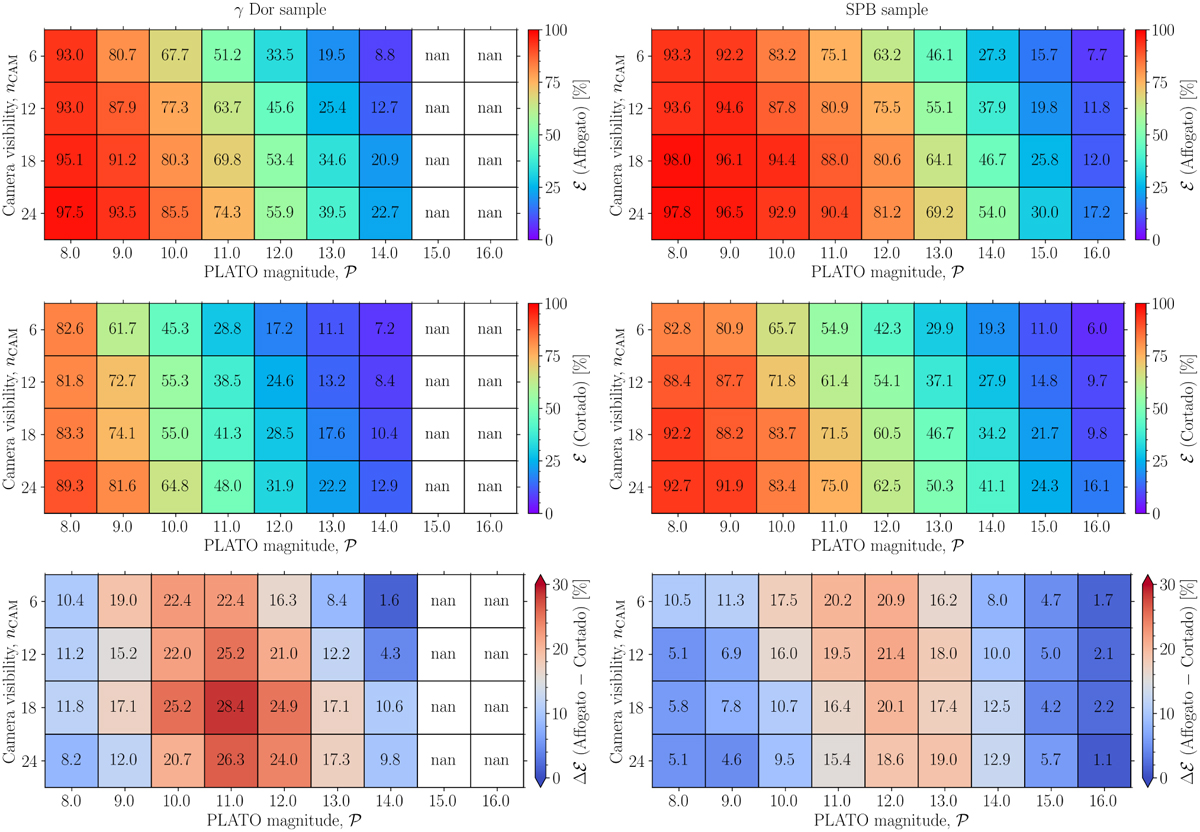
Detection efficiency diagrams (E in %) for the γ Dor sample (left panels) and SPB sample (right panels). The top and middle panels show the detection efficiency as a function of the camera visibility for AFFOGATO and CORTADO, respectively. The bottom panels show the residuals (∆E in %) between the results of AFFOGATO and CORTADO. White boxes marked as ‘nan’ are outside the simulated parameter space. Note a direct comparison is possible between the two samples with respect to the colour scaling.
Current usage metrics show cumulative count of Article Views (full-text article views including HTML views, PDF and ePub downloads, according to the available data) and Abstracts Views on Vision4Press platform.
Data correspond to usage on the plateform after 2015. The current usage metrics is available 48-96 hours after online publication and is updated daily on week days.
Initial download of the metrics may take a while.