Fig. 15
Download original image
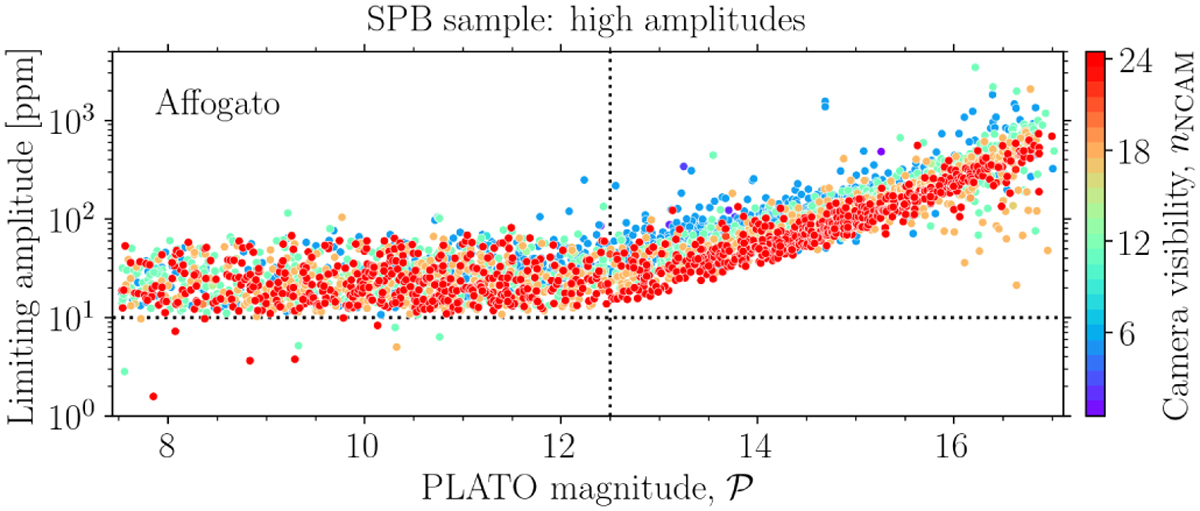
Limiting mode amplitude detection for the SPB sample, simulation batch AFFOGATO, and using an artificially increased mode amplitude distribution. The data points are colour-coded after camera visibility. The dotted vertical line marks a clear transition (at 𝒫 ∼ 12.5) between a noise floor plateau in the bright regime and an increasing detection limit in the faint regime.
Current usage metrics show cumulative count of Article Views (full-text article views including HTML views, PDF and ePub downloads, according to the available data) and Abstracts Views on Vision4Press platform.
Data correspond to usage on the plateform after 2015. The current usage metrics is available 48-96 hours after online publication and is updated daily on week days.
Initial download of the metrics may take a while.