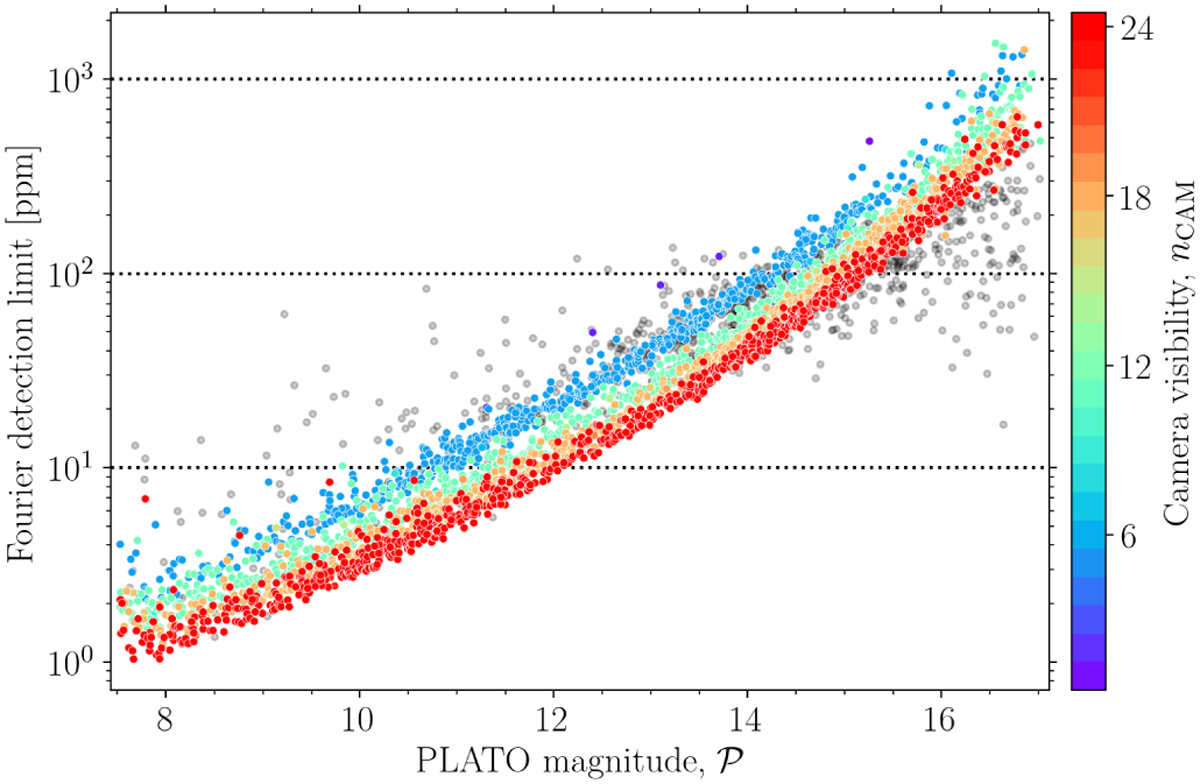
Fig. 13
Download original image
Amplitude detection limit from a prewhitening strategy using the S/N stopping criterion and a high amplitude version of the AFFOGATO SPB sample (cf. Sect. 6.2). This plot illustrates the general noise budget in the frequency domain enforced by random and systematic noise sources. Like in the time domain (see Fig. C.1), the detection limit at mission level is a clear function of the camera observability (colour scale). The dark grey data points are stars with a SPR value larger than 6% (a critical threshold explained in Sect. 6.5). The dotted horizontal lines are reference limits. We highlight that multiple stars have a camera visibility different from nCAM ∈ {6, 12, 18, 24} due to the usage of pointing error sources in our simulations (cf. Sect. 5.1). The same is true for Figs. 14 and 15. While we illustrate the star count histogram (versus nCAM) of this figure in Fig. C.4, the effect in this plot is most noticeable from the four (upper-most) purple/blue data points with nCAM ∈ {1, 2}.
Current usage metrics show cumulative count of Article Views (full-text article views including HTML views, PDF and ePub downloads, according to the available data) and Abstracts Views on Vision4Press platform.
Data correspond to usage on the plateform after 2015. The current usage metrics is available 48-96 hours after online publication and is updated daily on week days.
Initial download of the metrics may take a while.