Open Access
Fig. 11
Download original image
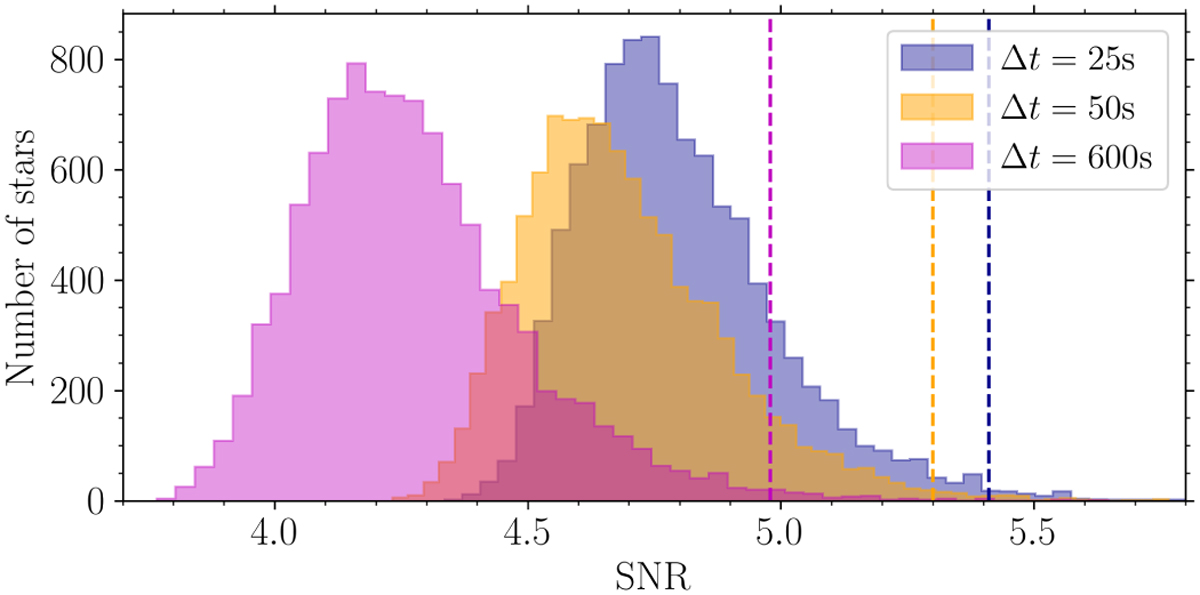
Histogram of the S/N of the highest amplitude frequency extracted from 10 000 synthetic white noise PLATO light curves. This example shows the optimal S/N criterion (dashed lines) estimated as the FAP = 1% from time series with a duration of eight mission quarters.
Current usage metrics show cumulative count of Article Views (full-text article views including HTML views, PDF and ePub downloads, according to the available data) and Abstracts Views on Vision4Press platform.
Data correspond to usage on the plateform after 2015. The current usage metrics is available 48-96 hours after online publication and is updated daily on week days.
Initial download of the metrics may take a while.