Open Access
Fig. 10
Download original image
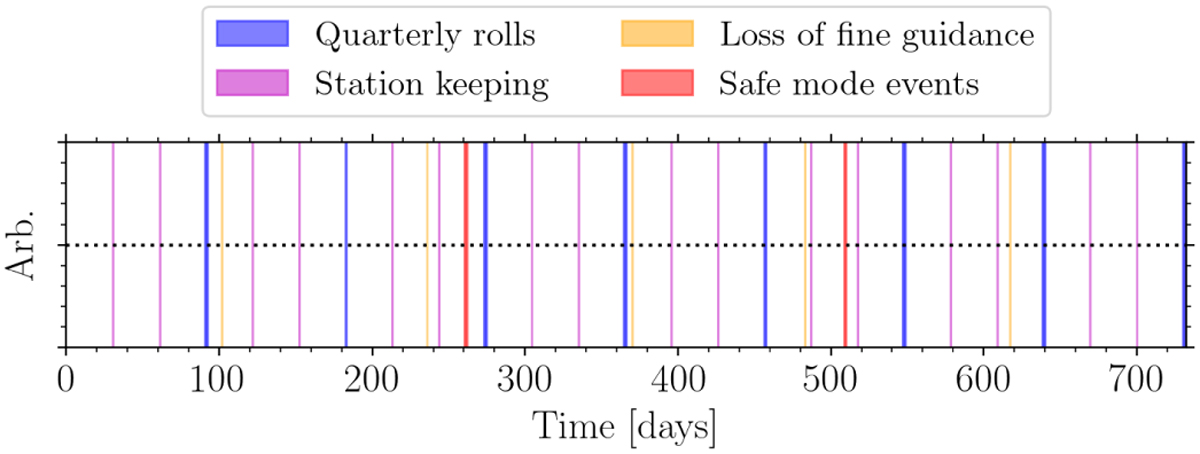
Assembly of data gaps included prior to the frequency analysis. Besides the quarterly rotational realignment of the spacecraft (blue lines), we also consider downtime due to station keeping manoeuvres (purple lines), loss of fine guidance (orange lines), and safe mode events (red lines).
Current usage metrics show cumulative count of Article Views (full-text article views including HTML views, PDF and ePub downloads, according to the available data) and Abstracts Views on Vision4Press platform.
Data correspond to usage on the plateform after 2015. The current usage metrics is available 48-96 hours after online publication and is updated daily on week days.
Initial download of the metrics may take a while.