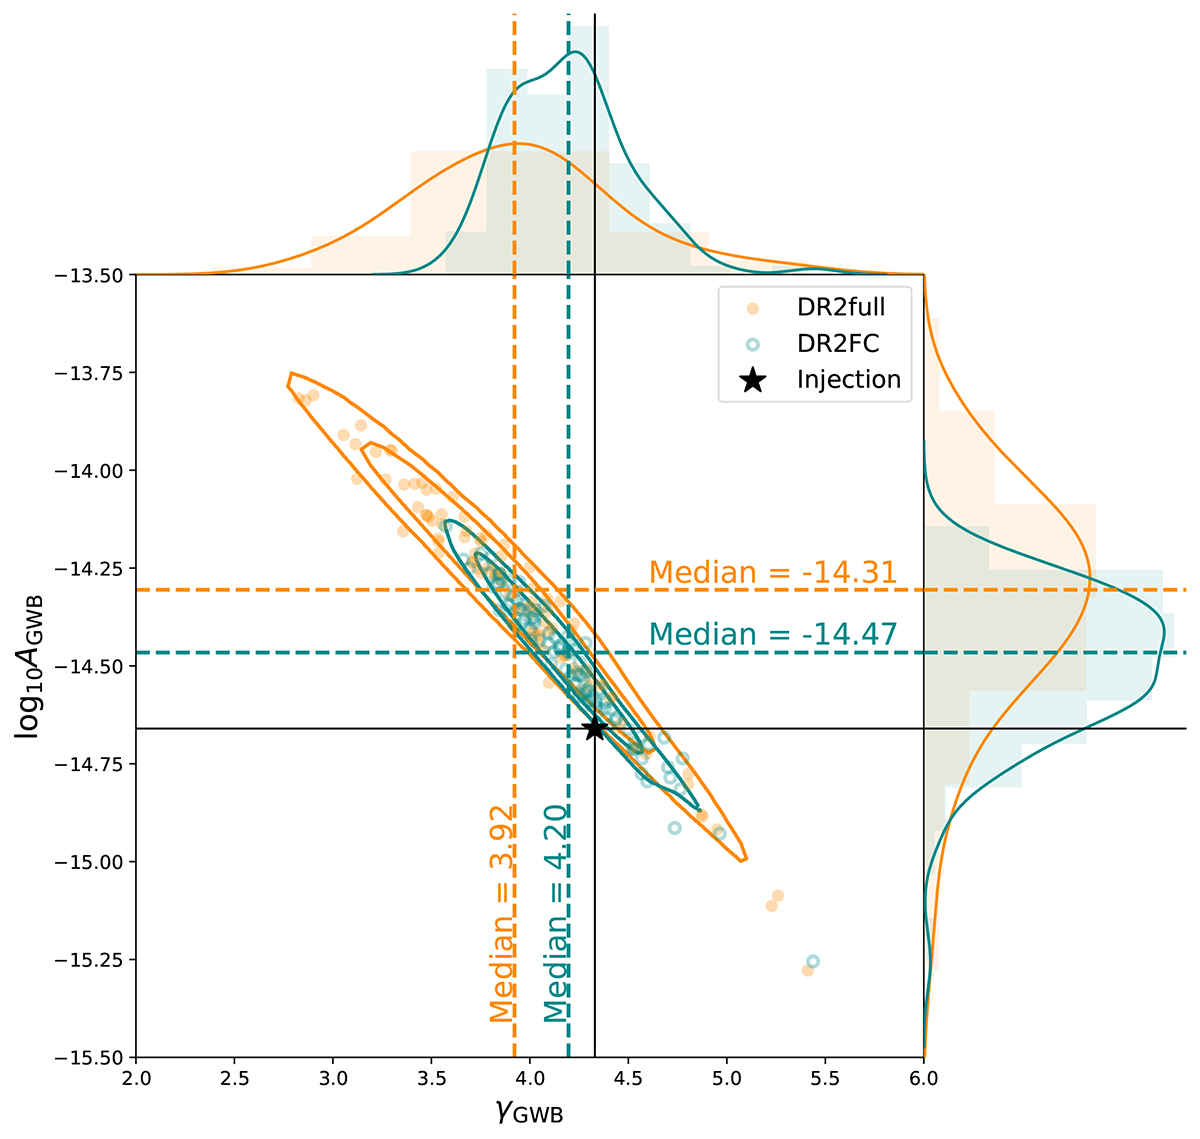
Fig. 7.
Download original image
Median of the posterior distributions of log10AGWB and γGWB obtained with the 100 realisations of DR2full (orange) and DR2FC (green). Dashed lines show the median of the 1D distributions, and the black solid line is the injection. Histograms and smoothed distributions on the top and right side of the plot represent the marginalised posterior distributions of the parameter recovery procedures.
Current usage metrics show cumulative count of Article Views (full-text article views including HTML views, PDF and ePub downloads, according to the available data) and Abstracts Views on Vision4Press platform.
Data correspond to usage on the plateform after 2015. The current usage metrics is available 48-96 hours after online publication and is updated daily on week days.
Initial download of the metrics may take a while.