Open Access
Fig. 4
Download original image
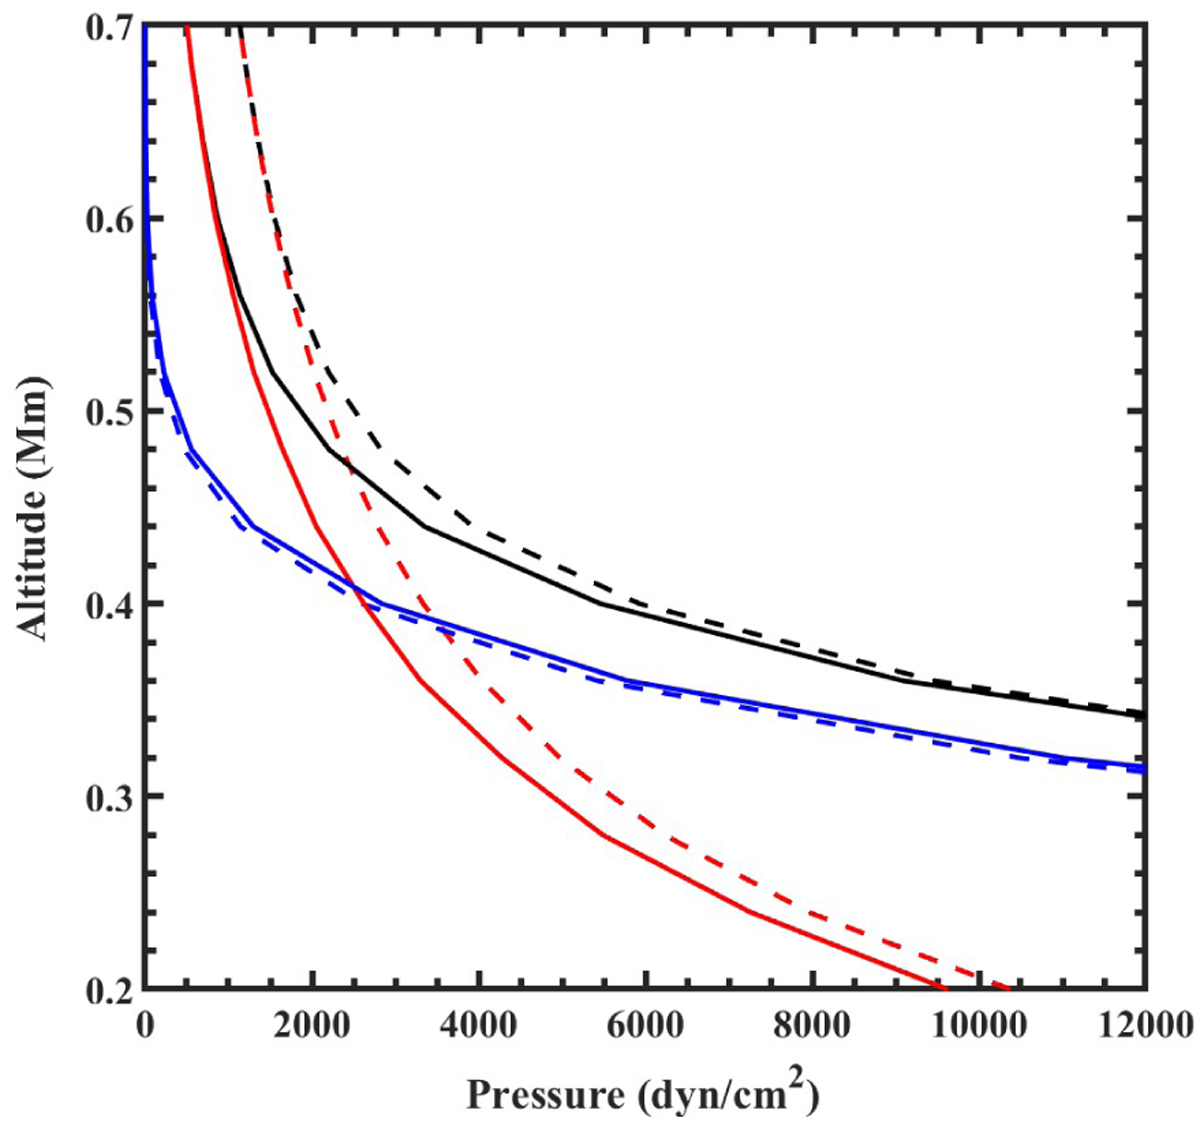
Comparison between the plasma pressure profile against ɀ before (dashed line) and after (solid line) optimization. The red line shows the magnetic pressure, the blue line represents the plasma pressure, and the black line shows the total pressure.
Current usage metrics show cumulative count of Article Views (full-text article views including HTML views, PDF and ePub downloads, according to the available data) and Abstracts Views on Vision4Press platform.
Data correspond to usage on the plateform after 2015. The current usage metrics is available 48-96 hours after online publication and is updated daily on week days.
Initial download of the metrics may take a while.