Fig. 1
Download original image
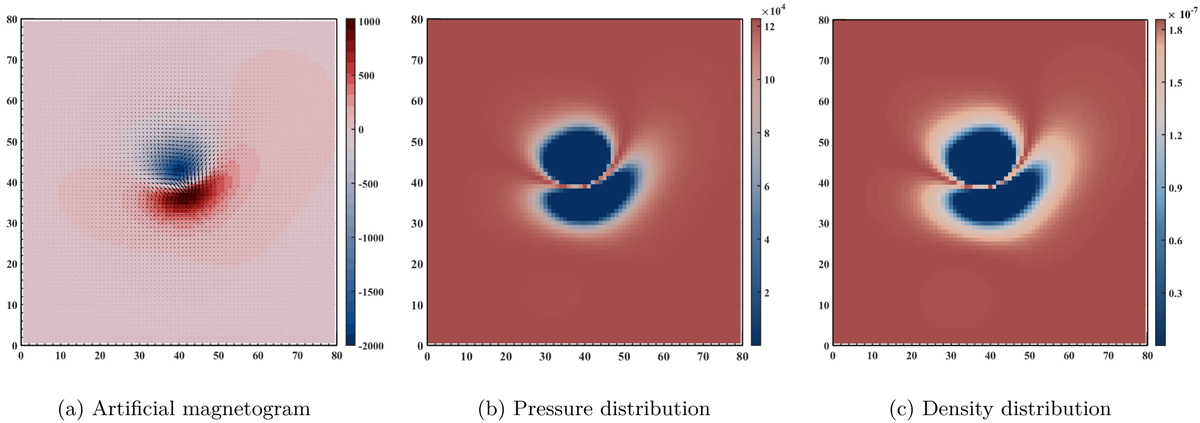
Boundary condition at the lower side of the box. (a) The artificial magnetogram (Gauss), (b) distribution of plasma pressure (dyn/cm2), and (c) distribution of plasma density (gr/cm3). In panel (a), the arrows represent the horizontal components of the magnetic field in the photosphere![]() . The intensity of the radial component of the magnetic field, | Bɀ |, is displayed via the colormap.
. The intensity of the radial component of the magnetic field, | Bɀ |, is displayed via the colormap.
Current usage metrics show cumulative count of Article Views (full-text article views including HTML views, PDF and ePub downloads, according to the available data) and Abstracts Views on Vision4Press platform.
Data correspond to usage on the plateform after 2015. The current usage metrics is available 48-96 hours after online publication and is updated daily on week days.
Initial download of the metrics may take a while.