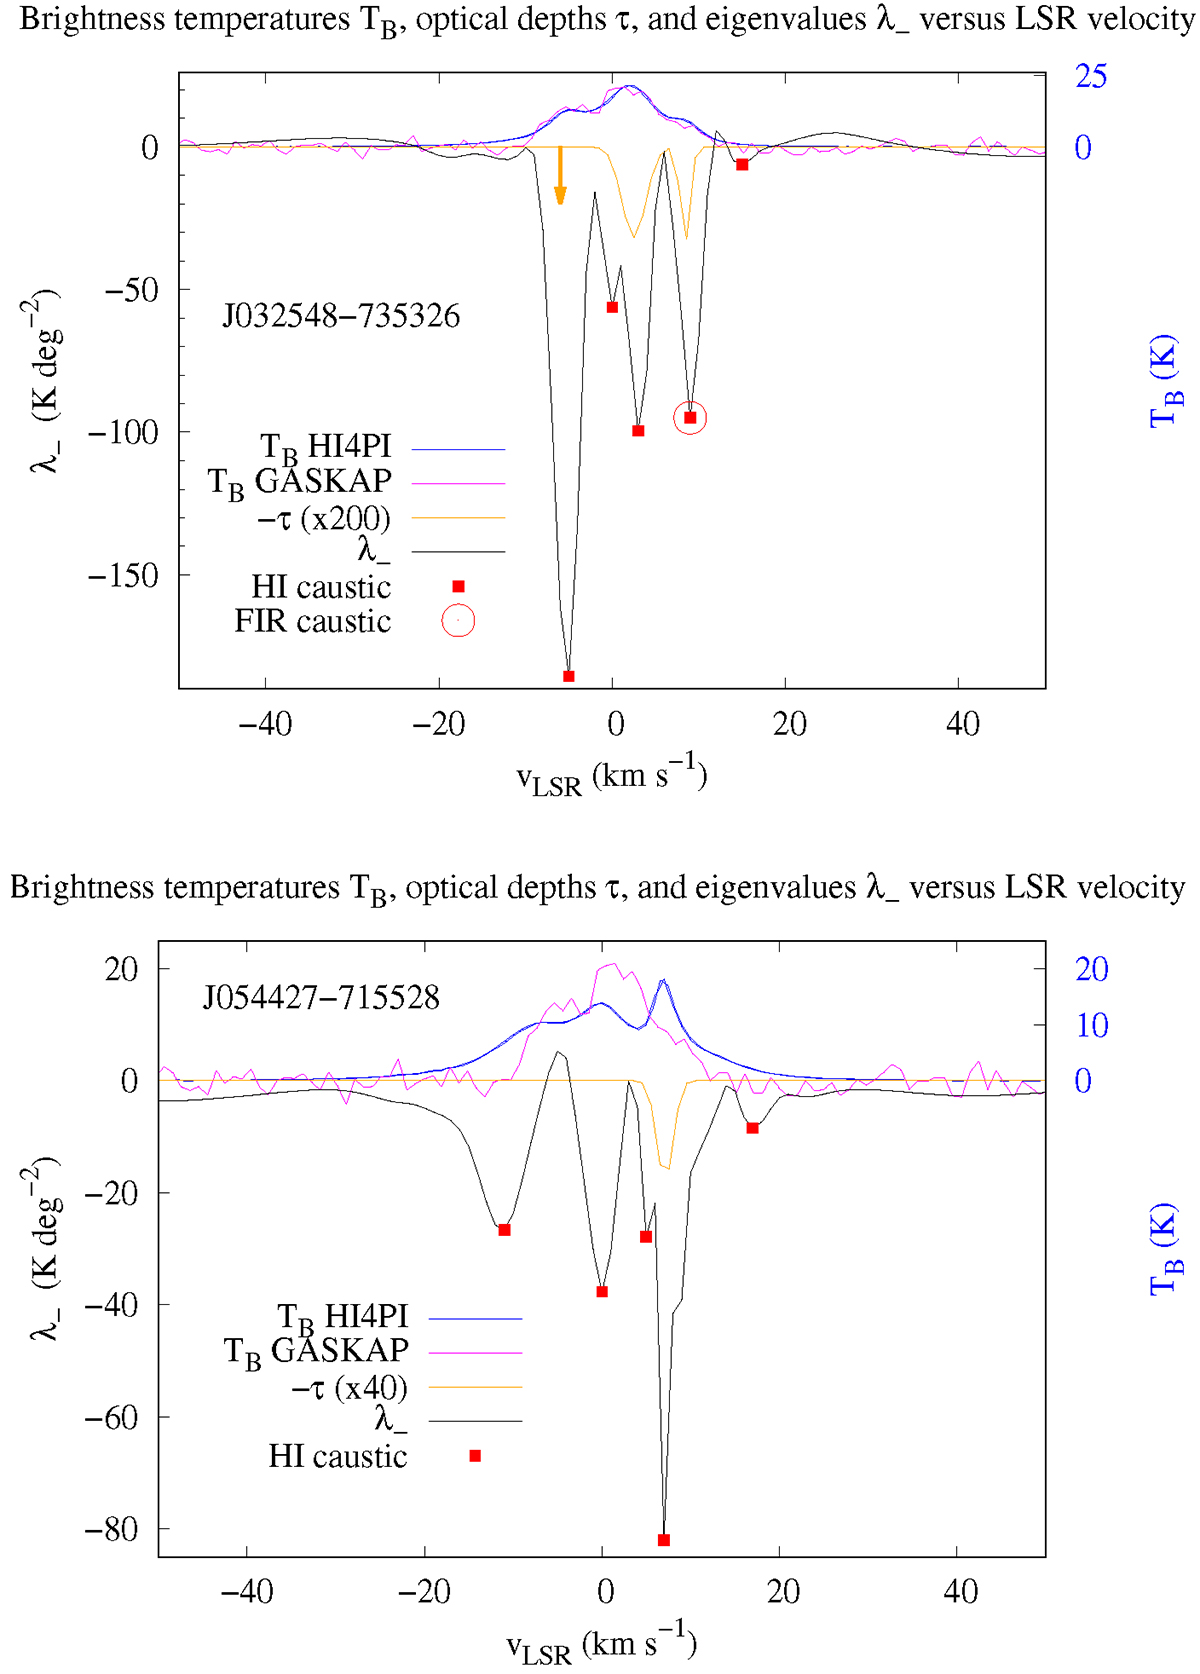
Fig. A.1.
Download original image
Hessian eigenvalues λ− (black) related to observed brightness temperatures at the nearest position. HI4PI data are indicated in blue and GASKAP-H I data in magenta. Critical points λ− < 0 are marked in red. Top: for the source J032548-735326 two absorption components (orange, scaled by a factor of 200) are indicated with an additional feature below the detection limit (arrow). For observational details see Fig. 8 of Nguyen et al. (2024). Bottom: the source J054427-715528 has a single absorption component (orange, scaled by a factor of 40). For observational details see Fig. 3 of Nguyen et al. (2024).
Current usage metrics show cumulative count of Article Views (full-text article views including HTML views, PDF and ePub downloads, according to the available data) and Abstracts Views on Vision4Press platform.
Data correspond to usage on the plateform after 2015. The current usage metrics is available 48-96 hours after online publication and is updated daily on week days.
Initial download of the metrics may take a while.