Fig. 4.
Download original image
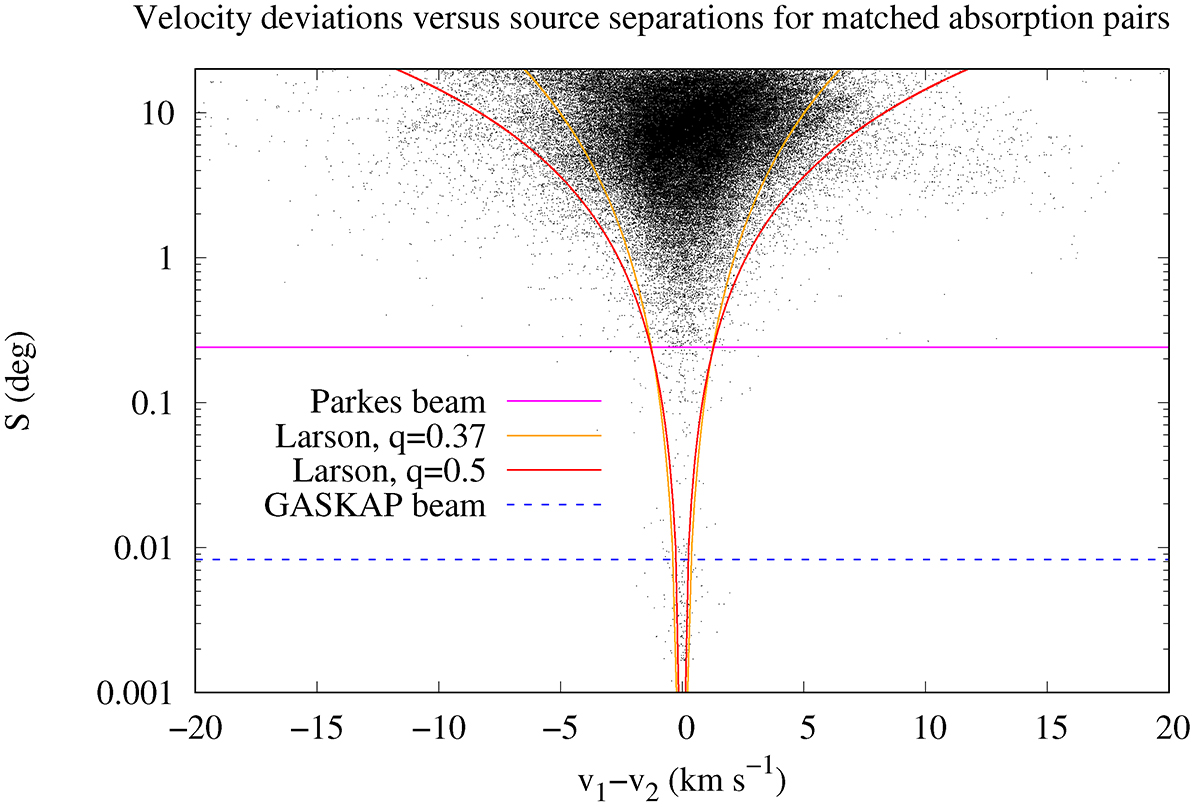
Velocity differences v1 − v2 depending on angular source separation S for matched absorption components. The horizontal lines indicate the Parkes and GASKAP beamwidths. The red and yellow lines display envelopes to the distribution, assuming a turbulent scaling between velocity and length scale (Larson 1979) with exponent q (see text).
Current usage metrics show cumulative count of Article Views (full-text article views including HTML views, PDF and ePub downloads, according to the available data) and Abstracts Views on Vision4Press platform.
Data correspond to usage on the plateform after 2015. The current usage metrics is available 48-96 hours after online publication and is updated daily on week days.
Initial download of the metrics may take a while.