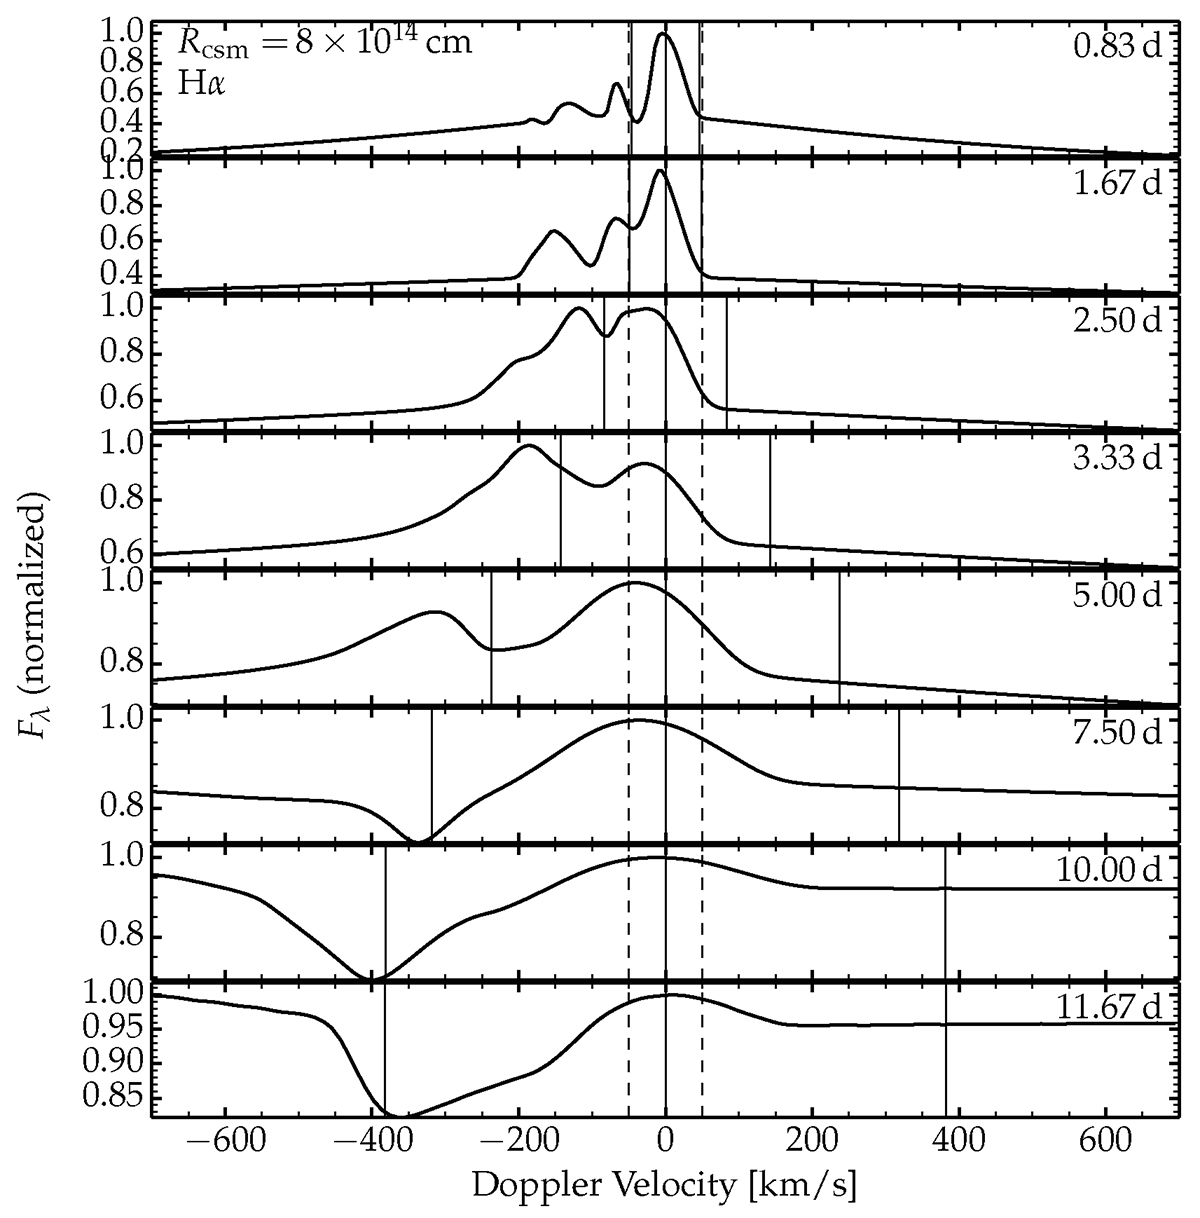
Fig. 3.
Download original image
Evolution of the spectral region centered on the rest wavelength of Hα for model mdot0p01/rcsm8e14. The symmetric solid vertical lines on each side of the origin correspond to the velocity at the location in the unshocked CSM where the electron-scattering optical depth is 0.01, thus exterior to the location of the photosphere. The dashed vertical lines correspond to ± V∞ of the original, unadulterated CSM. The spectral evolution in other H I Balmer lines is analogous to that shown here for Hα (see the case of Hβ shown in the left panel of Fig. A.2). Note that He II 6560.09 Å contributes some flux on the blue edge of Hα, well separated from it initially but overlapping with the Hα emission at 2–5 d. The ordinate range changes in each panel for better visibility.
Current usage metrics show cumulative count of Article Views (full-text article views including HTML views, PDF and ePub downloads, according to the available data) and Abstracts Views on Vision4Press platform.
Data correspond to usage on the plateform after 2015. The current usage metrics is available 48-96 hours after online publication and is updated daily on week days.
Initial download of the metrics may take a while.