Open Access
Fig. A.3.
Download original image
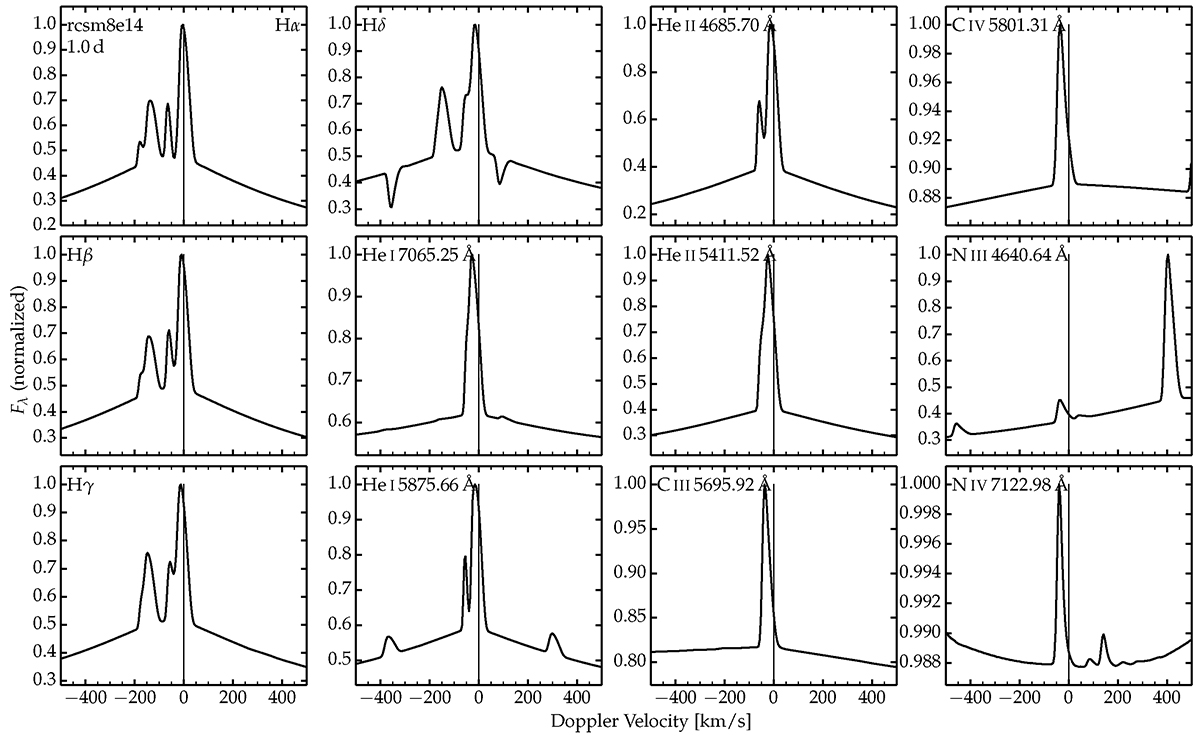
Mosaic showing various lines of H I, He I, He II, C III, C IV, and N IV for the reference model mdot0p01/rcsm8e14 at 1 d. In all cases, the x-axis covers from ± 500 km s−1 but the y-axis covers a wide range of normalized fluxes, with very strong narrow emission lines like Hα and much weaker ones like N IV 7122.98 Å.
Current usage metrics show cumulative count of Article Views (full-text article views including HTML views, PDF and ePub downloads, according to the available data) and Abstracts Views on Vision4Press platform.
Data correspond to usage on the plateform after 2015. The current usage metrics is available 48-96 hours after online publication and is updated daily on week days.
Initial download of the metrics may take a while.