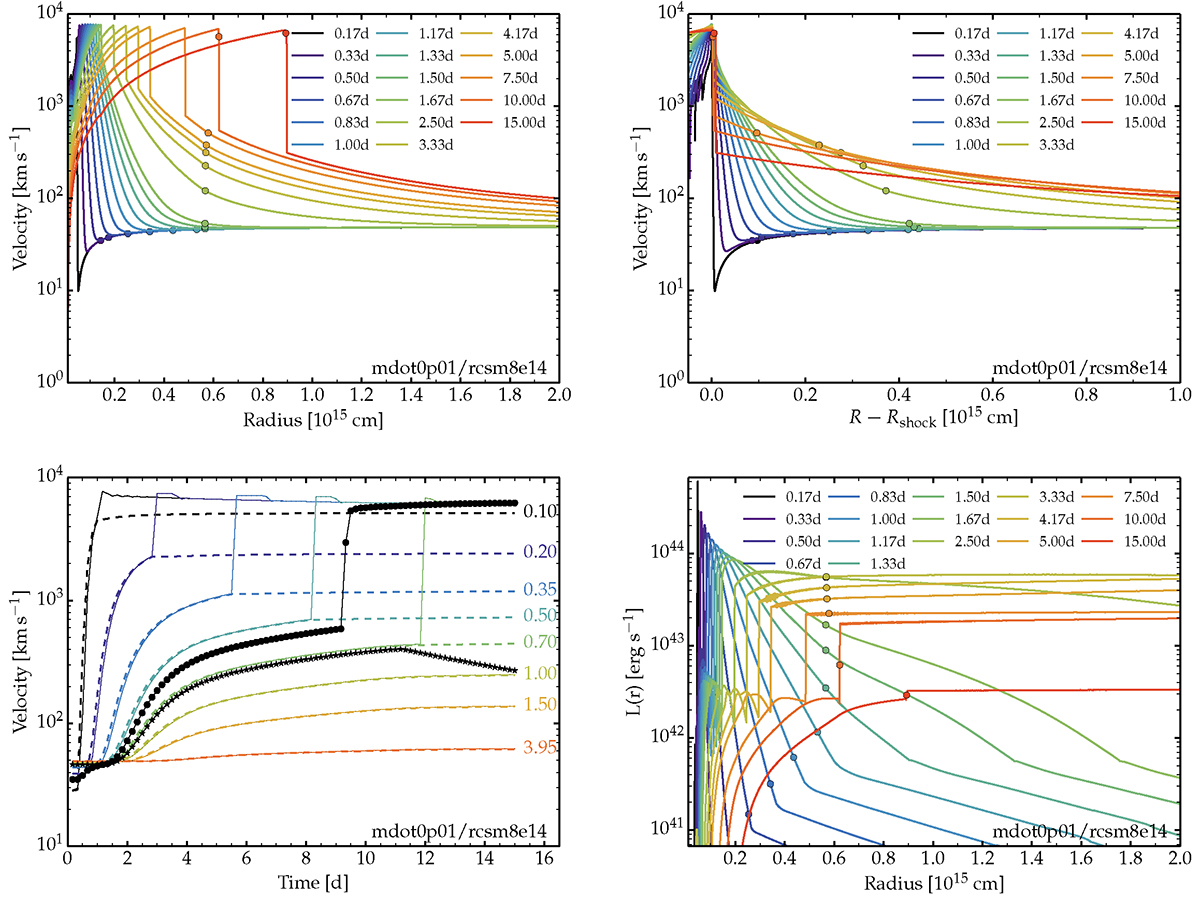
Fig. 2.
Download original image
Illustration of radiation and hydrodynamical properties computed by HERACLES for model mdot0p01/rcsm8e14. Top row: Variation in the velocity at multiple epochs versus radius (top left) and versus the distance above the shock (top right). Bottom left: Evolution of the velocity of “mass parcels” initially at radii 0.1, 0.2, 0.35, 0.5, 0.7, 1.0, 1.5, and 3.95 × 1015 cm (the last radius is near the outer grid boundary) and over the full duration of 15 d of the HERACLES simulation. The solid line shows the value of this velocity as read in directly from the simulation. The dashed line shows the same quantity but estimated through a time integral of the radiative acceleration (see the discussion in Sect. 3.1). In all cases, the two curves agree closely until the mass parcel is shocked, which corresponds to the near-vertical jump of the solid lines. The black circles and the stars indicate the velocity at the location where the electron-scattering optical depth is 2/3 (i.e., the photosphere) and at 0.01. Bottom right: Counterpart of the top-left panel but for the luminosity (i.e., quantity Lr = 4πr2Fr). Only the inner half of the grid is shown.
Current usage metrics show cumulative count of Article Views (full-text article views including HTML views, PDF and ePub downloads, according to the available data) and Abstracts Views on Vision4Press platform.
Data correspond to usage on the plateform after 2015. The current usage metrics is available 48-96 hours after online publication and is updated daily on week days.
Initial download of the metrics may take a while.