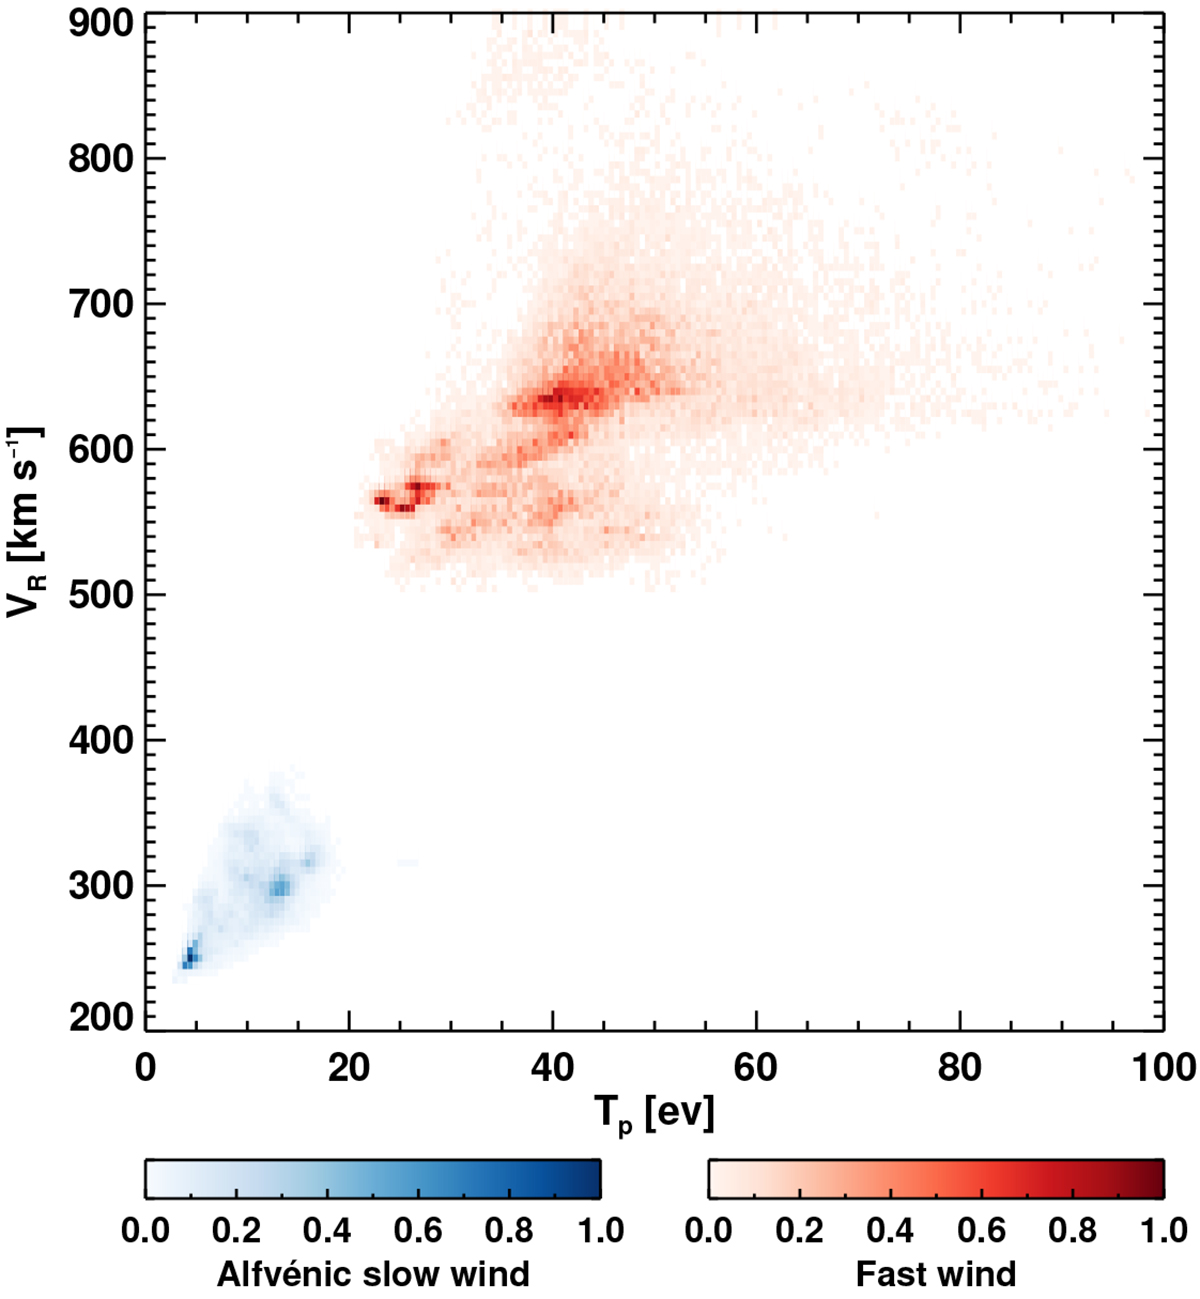
Fig. A.1.
Download original image
Proton temperature and radial velocity correlation. Two-dimensional histograms of Tp vs. VR. The red population corresponds to the fast wind streams presented in Fig. 1, whereas the blue population corresponds to data from the Alfvénic slow wind streams from Fig. 3. The normalized population density is indicated by the respective colorbar.
Current usage metrics show cumulative count of Article Views (full-text article views including HTML views, PDF and ePub downloads, according to the available data) and Abstracts Views on Vision4Press platform.
Data correspond to usage on the plateform after 2015. The current usage metrics is available 48-96 hours after online publication and is updated daily on week days.
Initial download of the metrics may take a while.