Fig. E.2.
Download original image
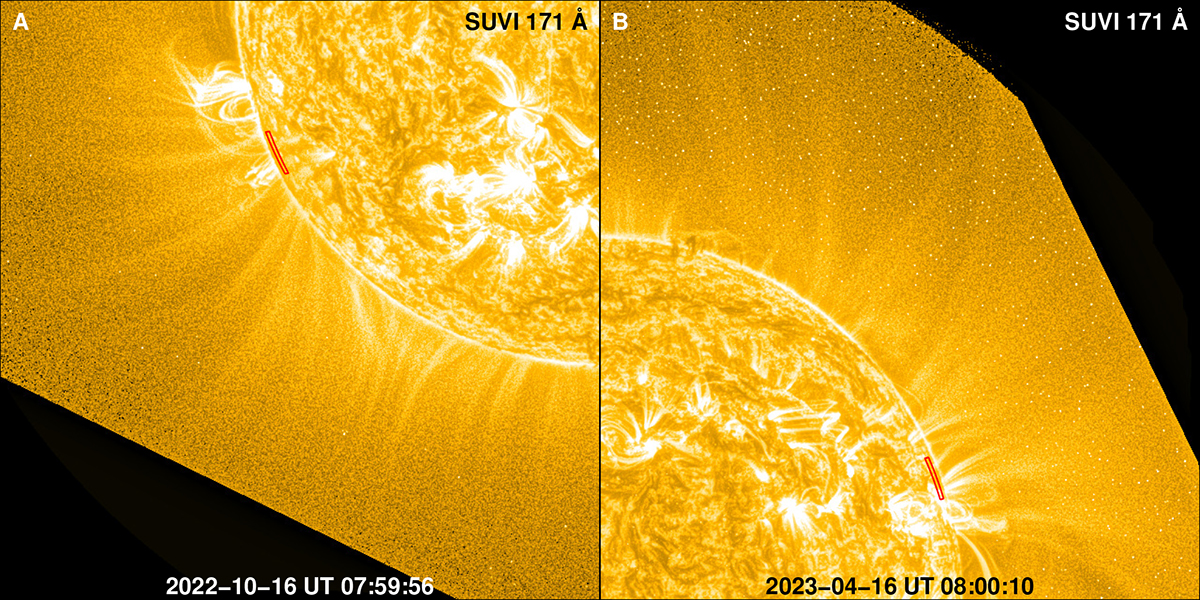
Visualizing the expansion of coronal holes. (A) Zoom into the south-east quadrant of the SUVI image shown in Fig. D.1B, but without the cyan colored lines overlaid. The section of the October 2022 coronal hole projected at the east limb is marked by the red line. (B) Zoom into the north-west quadrant of the SUVI image displayed in Fig. D.1D, for the case of April 2023 coronal hole.
Current usage metrics show cumulative count of Article Views (full-text article views including HTML views, PDF and ePub downloads, according to the available data) and Abstracts Views on Vision4Press platform.
Data correspond to usage on the plateform after 2015. The current usage metrics is available 48-96 hours after online publication and is updated daily on week days.
Initial download of the metrics may take a while.