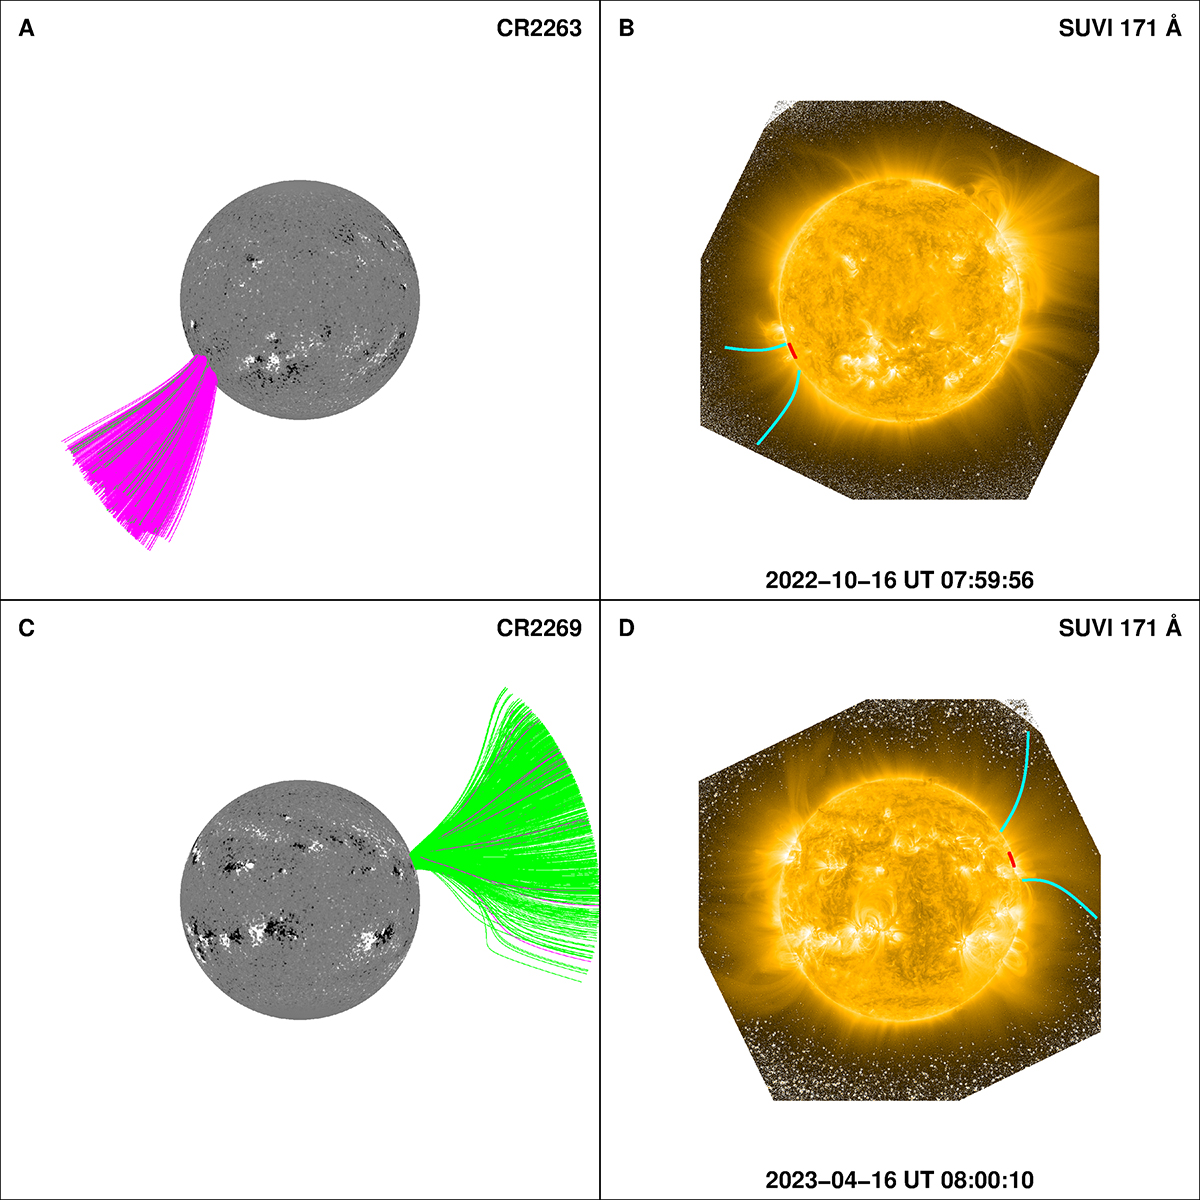
Fig. E.1.
Download original image
Visualizing the expansion of coronal holes. (A) CR2263 synoptic map rendered as a sphere, with FOV of 5 R⊙ × 5 R⊙. Radial magnetic field strength saturated at ±100 G. The lines trace magnetic field lines from the coronal hole location at the solar surface to the source surface at 2.5 R⊙. (B) GOES/SUVI 171 Å passband image showing the section of the October 2022 coronal hole projected at the east limb (marked by the red line). The cyan colored lines outline the coronal hole structure on the plane-of-sky. (C) Same as panel A but plotted for the case of CR2269. (D) Same as panel B but plotted for the case of the April 2023 coronal hole. Zoomed-in views of the observed coronal hole sections are further displayed in Fig. D.2.
Current usage metrics show cumulative count of Article Views (full-text article views including HTML views, PDF and ePub downloads, according to the available data) and Abstracts Views on Vision4Press platform.
Data correspond to usage on the plateform after 2015. The current usage metrics is available 48-96 hours after online publication and is updated daily on week days.
Initial download of the metrics may take a while.