Fig. B.1
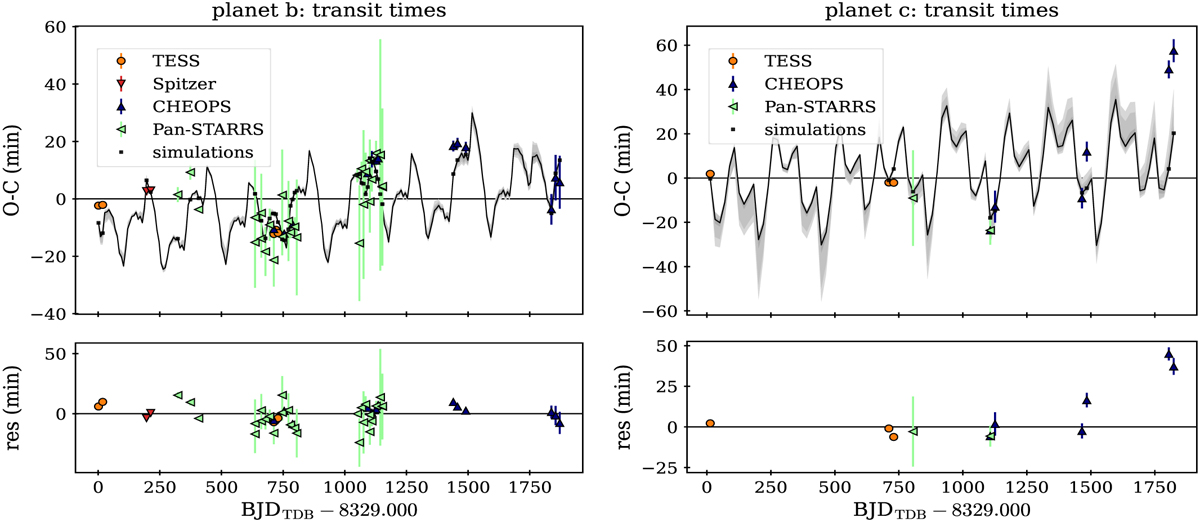
Download original image
TRADES modelling of AU Mic b (left panels) and AU Mic c (right panels) of configuration (1). Top panel: (O – C) diagram, observed T0s are plotted with coloured markers with black stroke (different colour and marker for each telescope), while the simulated O – C values computed by the best-fit TRADE S dynamical model are plotted as black line with black circles (corresponding to the observations). Grey-shaded areas correspond to 1, 2, and 3σ of random samples drawn from the posterior distribution of TRADES. Bottom panel: Residuals computed as the difference between observed and simulated T0s.
Current usage metrics show cumulative count of Article Views (full-text article views including HTML views, PDF and ePub downloads, according to the available data) and Abstracts Views on Vision4Press platform.
Data correspond to usage on the plateform after 2015. The current usage metrics is available 48-96 hours after online publication and is updated daily on week days.
Initial download of the metrics may take a while.