Fig. B.6
Download original image
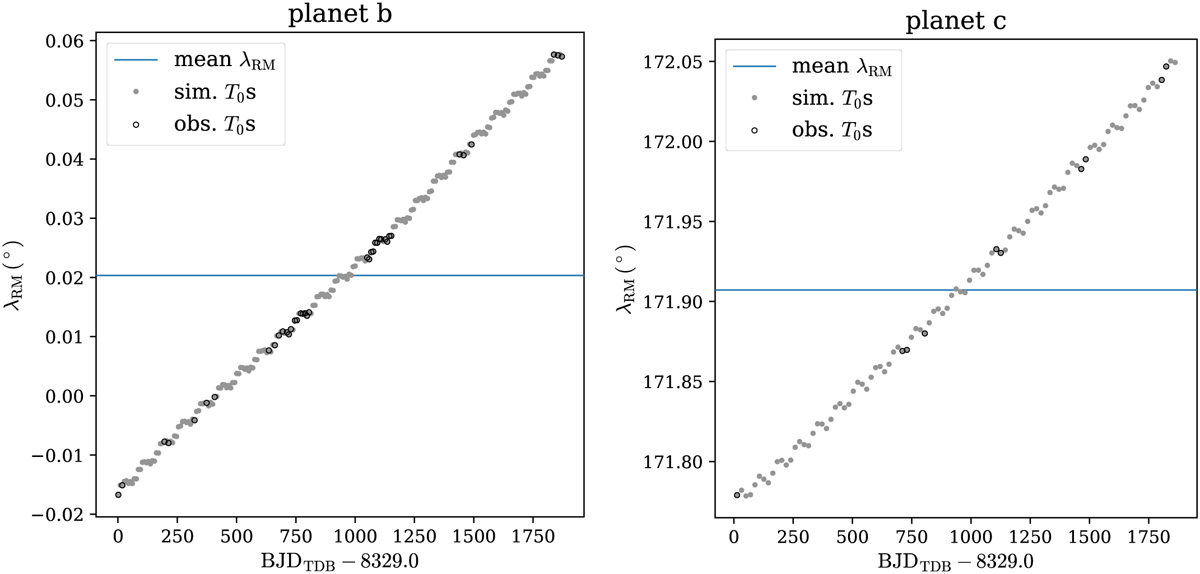
Projected spin-orbit misalignment (λRm) evolution computed at simulated transit during TRADES modelling of AU Mic b (left panels) and AU Mic c (right panels) of configuration (2). Gray circles are all the synthetic transit times, highlighted as black-open circle the corresponding observed transit times. The horizontal-blue line is the mean value of λRm.
Current usage metrics show cumulative count of Article Views (full-text article views including HTML views, PDF and ePub downloads, according to the available data) and Abstracts Views on Vision4Press platform.
Data correspond to usage on the plateform after 2015. The current usage metrics is available 48-96 hours after online publication and is updated daily on week days.
Initial download of the metrics may take a while.