Open Access
Fig. 8.
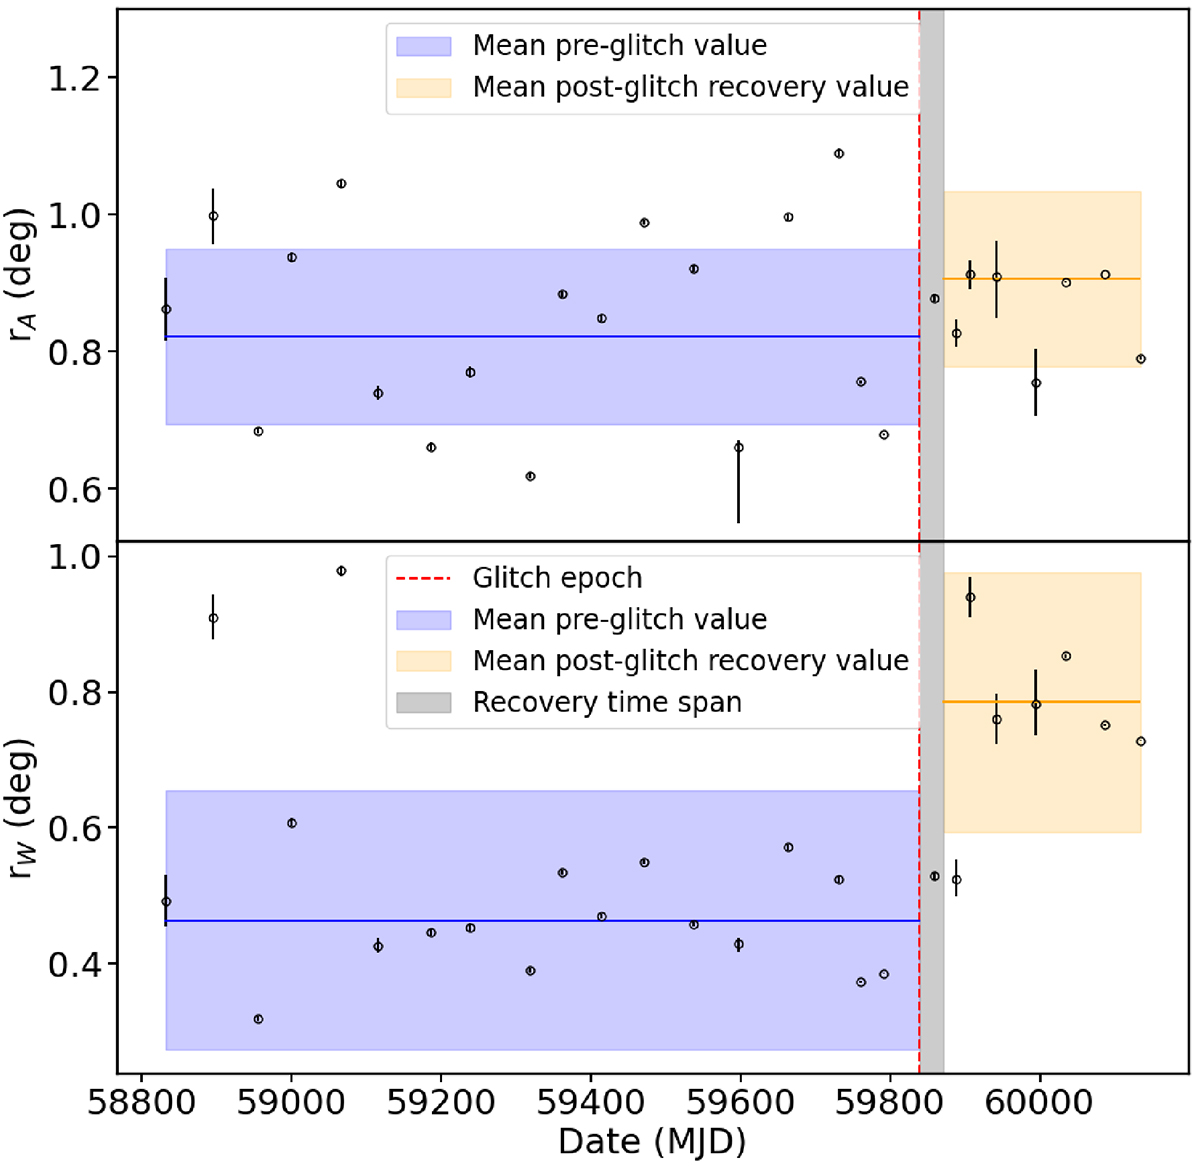
Download original image
Evolution of the ratio between the amplitudes and the widths of the Gaussian components. The horizontal bands correspond to the 1σ mean pre-glitch value and the 1σ mean post-glitch recovery value, respectively. The vertical grey band marks the glitch recovery data span.
Current usage metrics show cumulative count of Article Views (full-text article views including HTML views, PDF and ePub downloads, according to the available data) and Abstracts Views on Vision4Press platform.
Data correspond to usage on the plateform after 2015. The current usage metrics is available 48-96 hours after online publication and is updated daily on week days.
Initial download of the metrics may take a while.