Fig. 4
Download original image
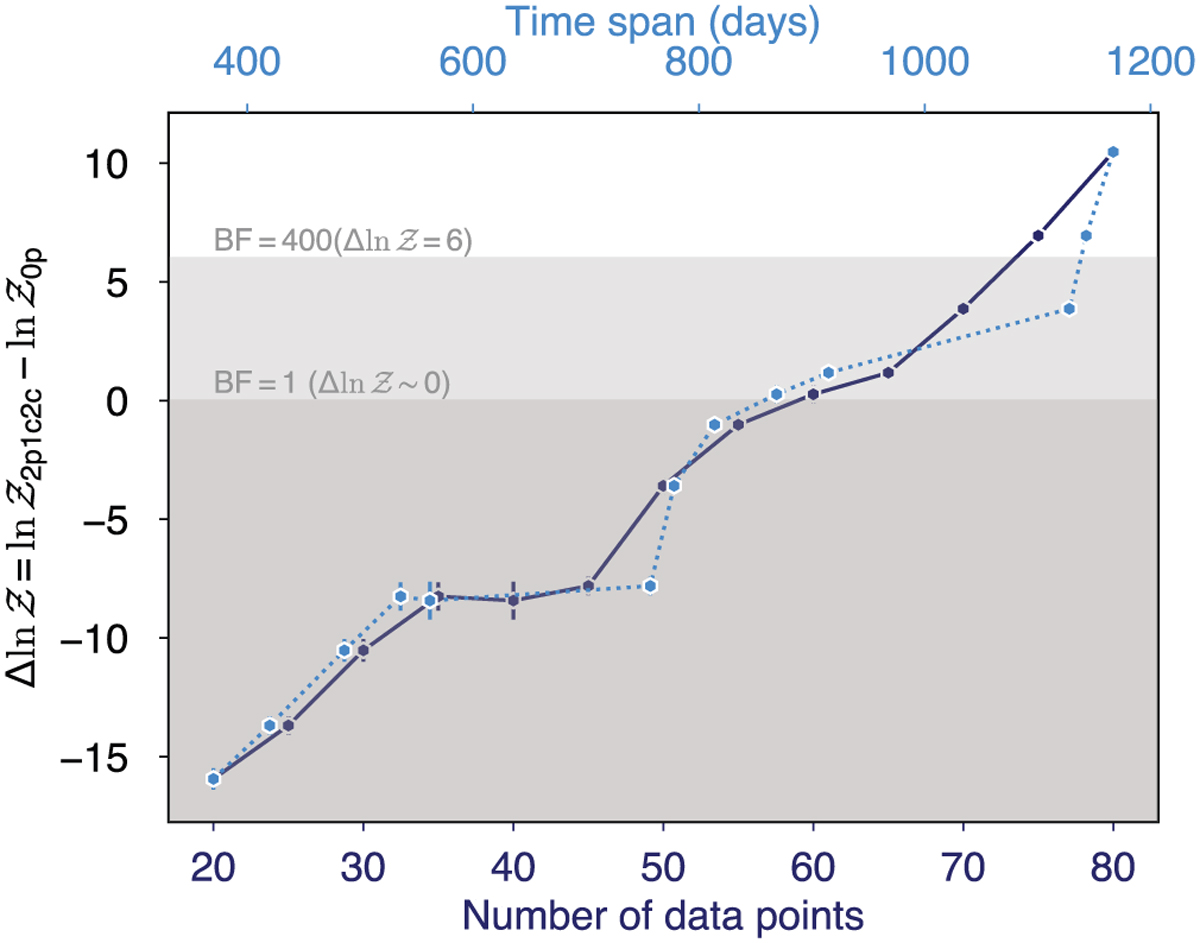
Evolution of the difference between the evidence of the two- planet model and the zero-planet model as a function of the number of data points (dark blue solid line and symbols, corresponding to the lower X-axis) and against the time from the first observation (light blue dotted line and symbols, corresponding to the upper X-axis). The regimes of Δ ln 𝒵 < 6 (or BF = 400) and Δ ln 𝒵 < 0 (BF = 1) are shown as dark and gray shaded regions, respectively.
Current usage metrics show cumulative count of Article Views (full-text article views including HTML views, PDF and ePub downloads, according to the available data) and Abstracts Views on Vision4Press platform.
Data correspond to usage on the plateform after 2015. The current usage metrics is available 48-96 hours after online publication and is updated daily on week days.
Initial download of the metrics may take a while.