Fig. 3
Download original image
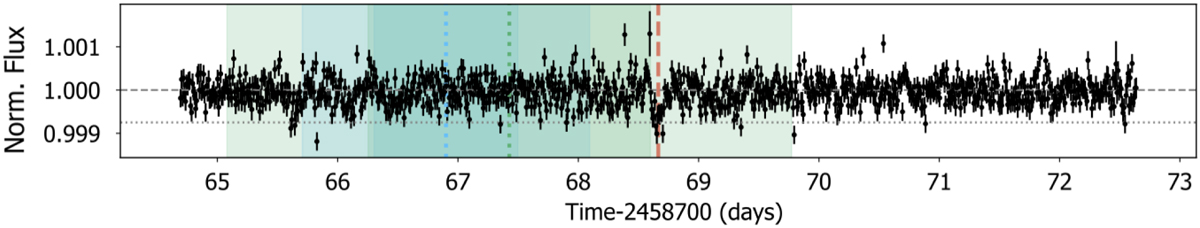
TESS light curves of the first half of sector 17 (before the down-link gap) for KOBE-1. The shaded regions represent the 68.7% (light) and 95% (dark) confidence intervals for the conjunction time of KOBE-1 b (blue) and KOBE-1 c (green) according to the RV analysis in Sect. 4.1. The vertical dotted lines correspond to the median of the expected transit time for each planet, while the vertical dashed red line indicates the location of the detected transit-like feature. The horizontal dashed line corresponds to 1 and the horizontal dotted line corresponds to the depth of a 2 R⊕ planet, for reference.
Current usage metrics show cumulative count of Article Views (full-text article views including HTML views, PDF and ePub downloads, according to the available data) and Abstracts Views on Vision4Press platform.
Data correspond to usage on the plateform after 2015. The current usage metrics is available 48-96 hours after online publication and is updated daily on week days.
Initial download of the metrics may take a while.