Fig. B.1
Download original image
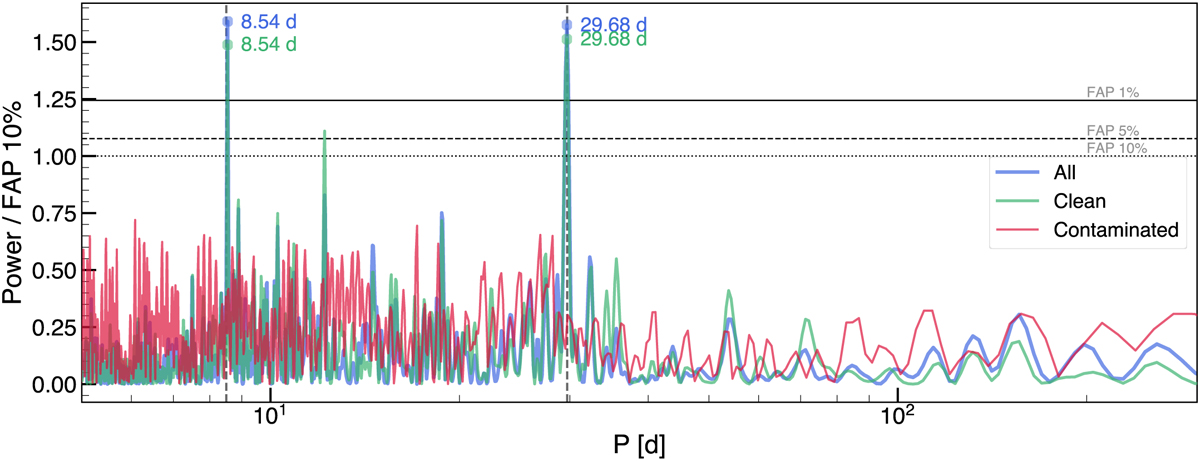
GLS periodogram of the full sample of RVs obtained for KOBE-1 (blue line), the sub-sample of data points after excluding the possibly Moon-contaminated observations (green line) and the sub-sample of the affected data points (red line). The three false alarm probability level of 10%, 5% and 1% are shown as black horizontal lines.
Current usage metrics show cumulative count of Article Views (full-text article views including HTML views, PDF and ePub downloads, according to the available data) and Abstracts Views on Vision4Press platform.
Data correspond to usage on the plateform after 2015. The current usage metrics is available 48-96 hours after online publication and is updated daily on week days.
Initial download of the metrics may take a while.