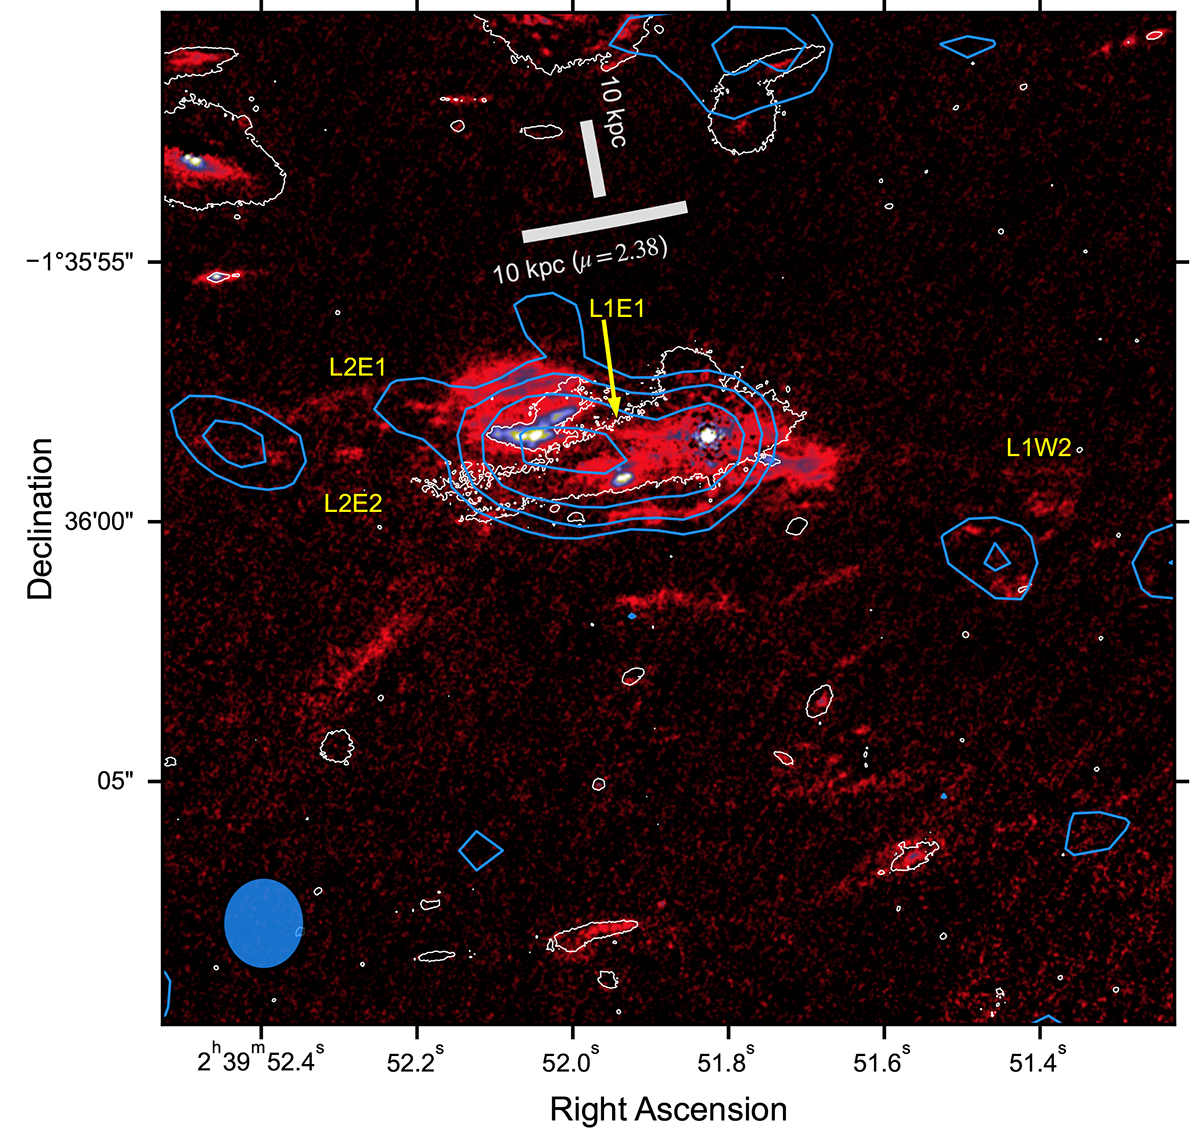
Fig. D.2.
Download original image
Map of radio emission. 1.4 GHz radio continuum is shown as blue contours, overlaid on the [O III] map in the background. The white contours and the grey scale bars represent the stellar continuum and 10 kpc size in the rest-frame, in the same format as Fig. D.1. The names of some relevant [O III] emitting features are labeled as yellow text. The radio map contours correspond to +2, 4, 8, 16 σ, and the synthesized beam is shown at the lower left corner as a filled blue ellipse.
Current usage metrics show cumulative count of Article Views (full-text article views including HTML views, PDF and ePub downloads, according to the available data) and Abstracts Views on Vision4Press platform.
Data correspond to usage on the plateform after 2015. The current usage metrics is available 48-96 hours after online publication and is updated daily on week days.
Initial download of the metrics may take a while.