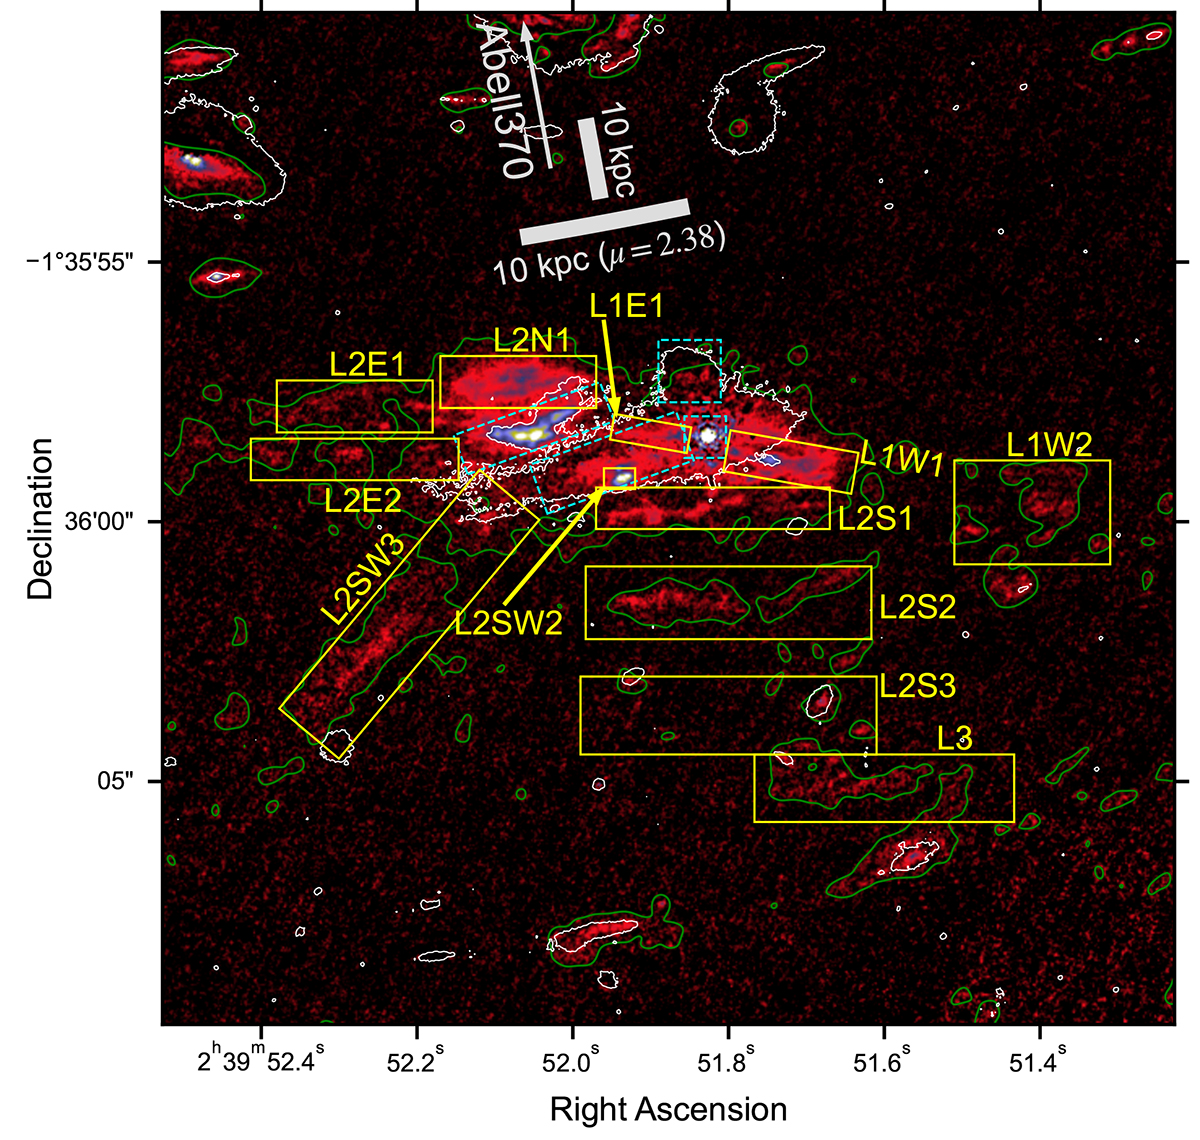
Fig. D.1.
Download original image
Identification of the [O III] emitting features. The solid yellow boxes highlight the regions of the extended [O III] emission discussed in the work with labels. As a visual aid for identifying diffuse emission, we plot the solid green contours corresponding to the 3-σ level (1.8 × 10⁻¹⁷ erg s−1 cm−2 arcsec−2) of the [O III] line map when smoothed to a resolution of 0.3”, enclosing most of the reliable features of extended emission features. The solid white contours correspond to the stellar continuum in Fig. 1 starting at 10-σ flux density level 4.2 × 10⁻² MJy sr−1. The dashed cyan boxes mark the same continuum sources as in Fig. 1. The grey arrow and scale bars are copied from Fig. 1.
Current usage metrics show cumulative count of Article Views (full-text article views including HTML views, PDF and ePub downloads, according to the available data) and Abstracts Views on Vision4Press platform.
Data correspond to usage on the plateform after 2015. The current usage metrics is available 48-96 hours after online publication and is updated daily on week days.
Initial download of the metrics may take a while.