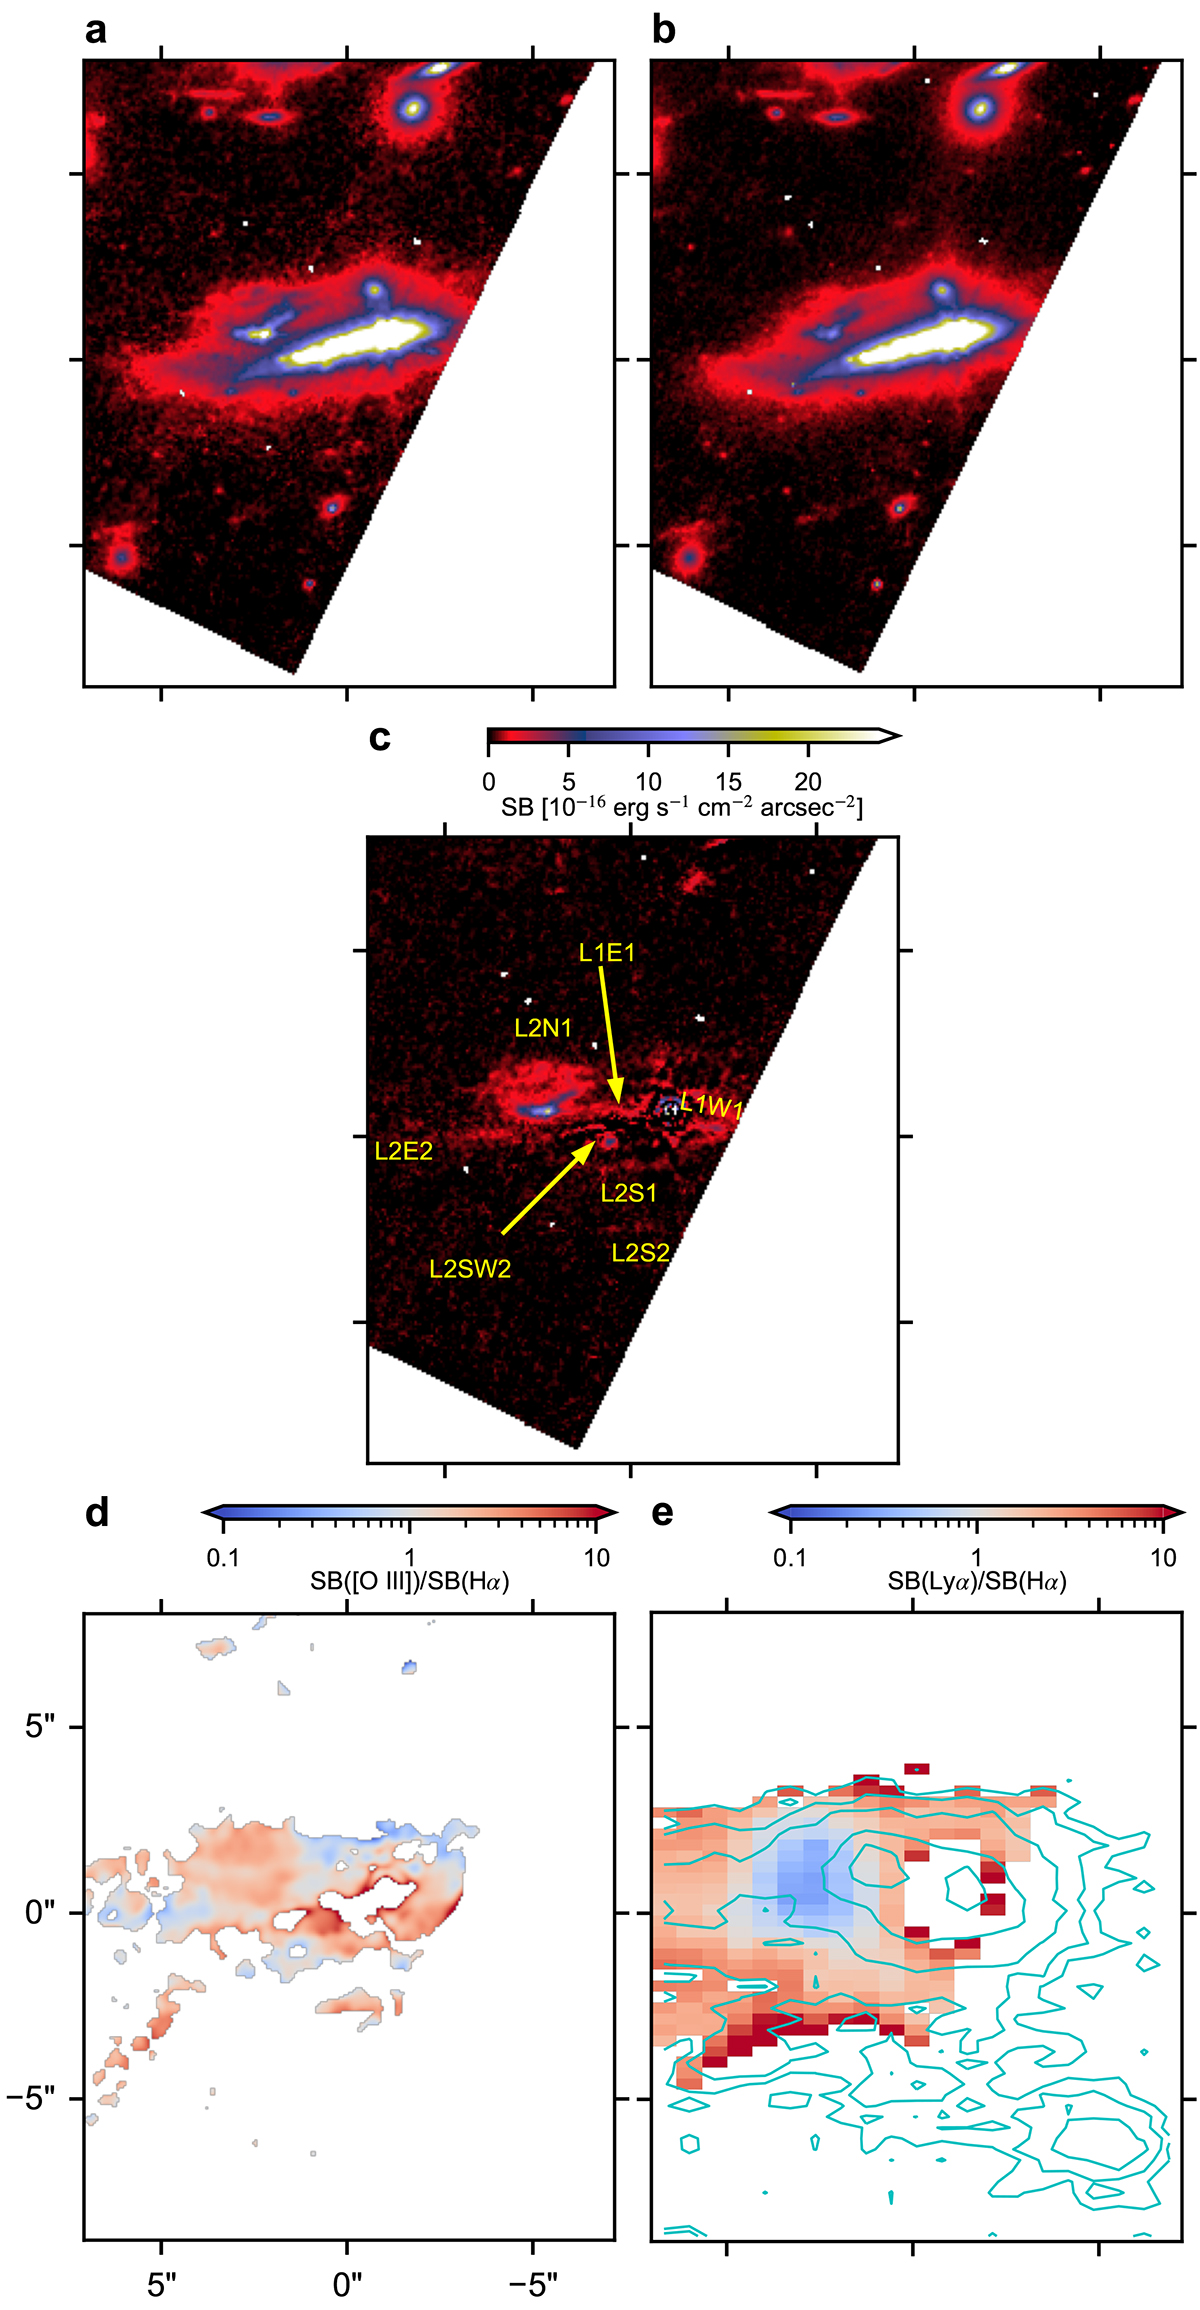
Fig. C.1.
Download original image
Processing and analysis on the Hα line map. a, JWST F277W image. b, the interpolated stellar continuum using the F210M, F300M, F335M, and F356W images. c, Hα line emission map produced by subtracting b from a. Some features identified in [O III] (Fig. D.1) that are also visible in Hα emission are labeled in the figure. d, [O III]-to-Hα surface brightness ratio map, after smoothing both lines to a common spatial resolution of 0.3”. e, Lyα-to-Hα surface brightness ratio map after smoothing the Hα map to match with the resolution of the Lyα map, overlaid with the Lyα contours. For the two line ratio maps, only the pixels with surface brightness level higher than 2 σSB for both lines are used for making the line ratio map.
Current usage metrics show cumulative count of Article Views (full-text article views including HTML views, PDF and ePub downloads, according to the available data) and Abstracts Views on Vision4Press platform.
Data correspond to usage on the plateform after 2015. The current usage metrics is available 48-96 hours after online publication and is updated daily on week days.
Initial download of the metrics may take a while.