Fig. B.1.
Download original image
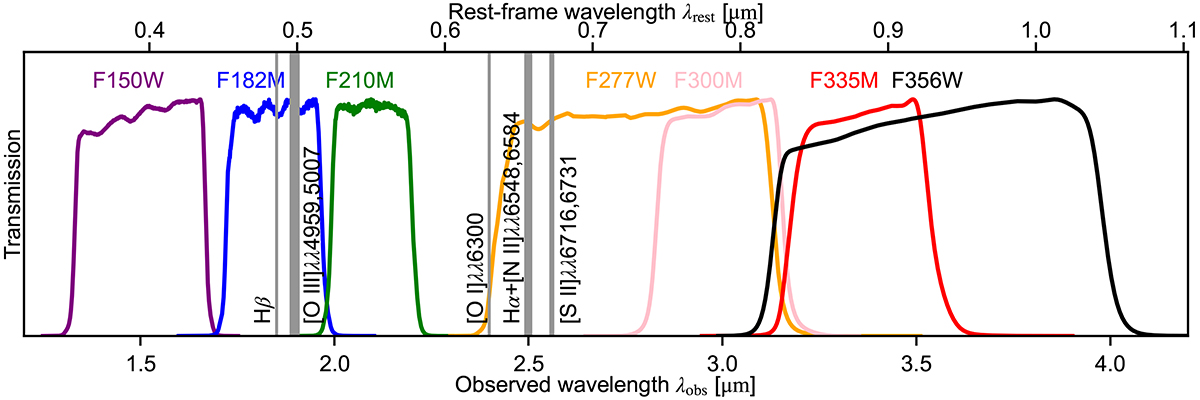
Illustration of the filters used in the Letter and their coverage of optical strong lines. The normalized transmission curves of each filters are plotted in solid lines, with the filter names labeled on top in the same color. The relevant optical strong lines (or complexes) are shown as vertical gray bands covering the corresponding wavelength ranges, with lines labeled next to the bands.
Current usage metrics show cumulative count of Article Views (full-text article views including HTML views, PDF and ePub downloads, according to the available data) and Abstracts Views on Vision4Press platform.
Data correspond to usage on the plateform after 2015. The current usage metrics is available 48-96 hours after online publication and is updated daily on week days.
Initial download of the metrics may take a while.