Fig. 2.
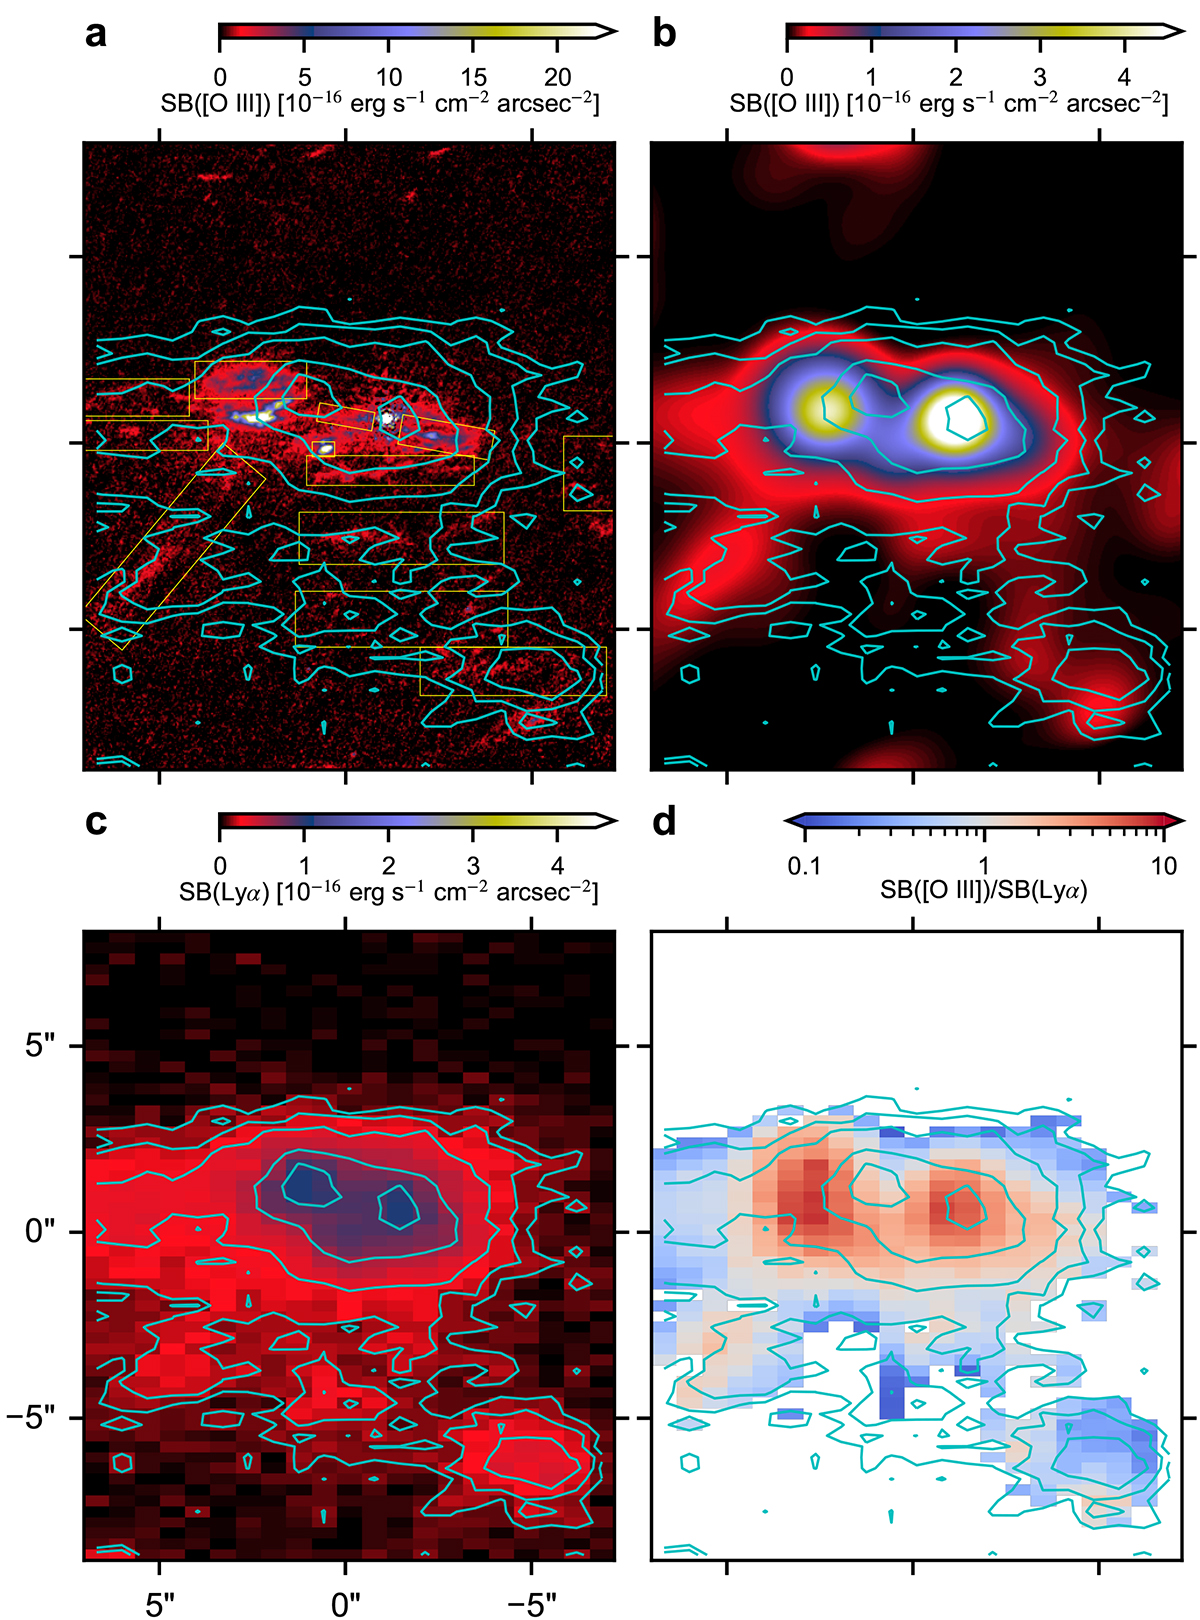
Download original image
Comparison between the [O III] and Lyα line maps. a, [O III] surface brightness map overlaid with the Lyα contours (cyan; Li et al. 2019). The Lyα contour levels correspond to +2, 3, 5, 10, and 15 σSB (Appendix B). The yellow boxes mark the same line emitting features as shown in Fig. D.1. b, [O III] map smoothed to the same resolution as the Lyα image for comparison, overlaid with the Lyα contours (cyan). c, Lyα surface brightness map. d, [O III]-to-Lyα surface brightness ratio map overlaid with the Lyα contours (cyan). Only the pixels with the surface brightness larger than the 2 σSB for both Lyα and the smoothed [O III] are plotted.
Current usage metrics show cumulative count of Article Views (full-text article views including HTML views, PDF and ePub downloads, according to the available data) and Abstracts Views on Vision4Press platform.
Data correspond to usage on the plateform after 2015. The current usage metrics is available 48-96 hours after online publication and is updated daily on week days.
Initial download of the metrics may take a while.