Fig. 1.
Download original image
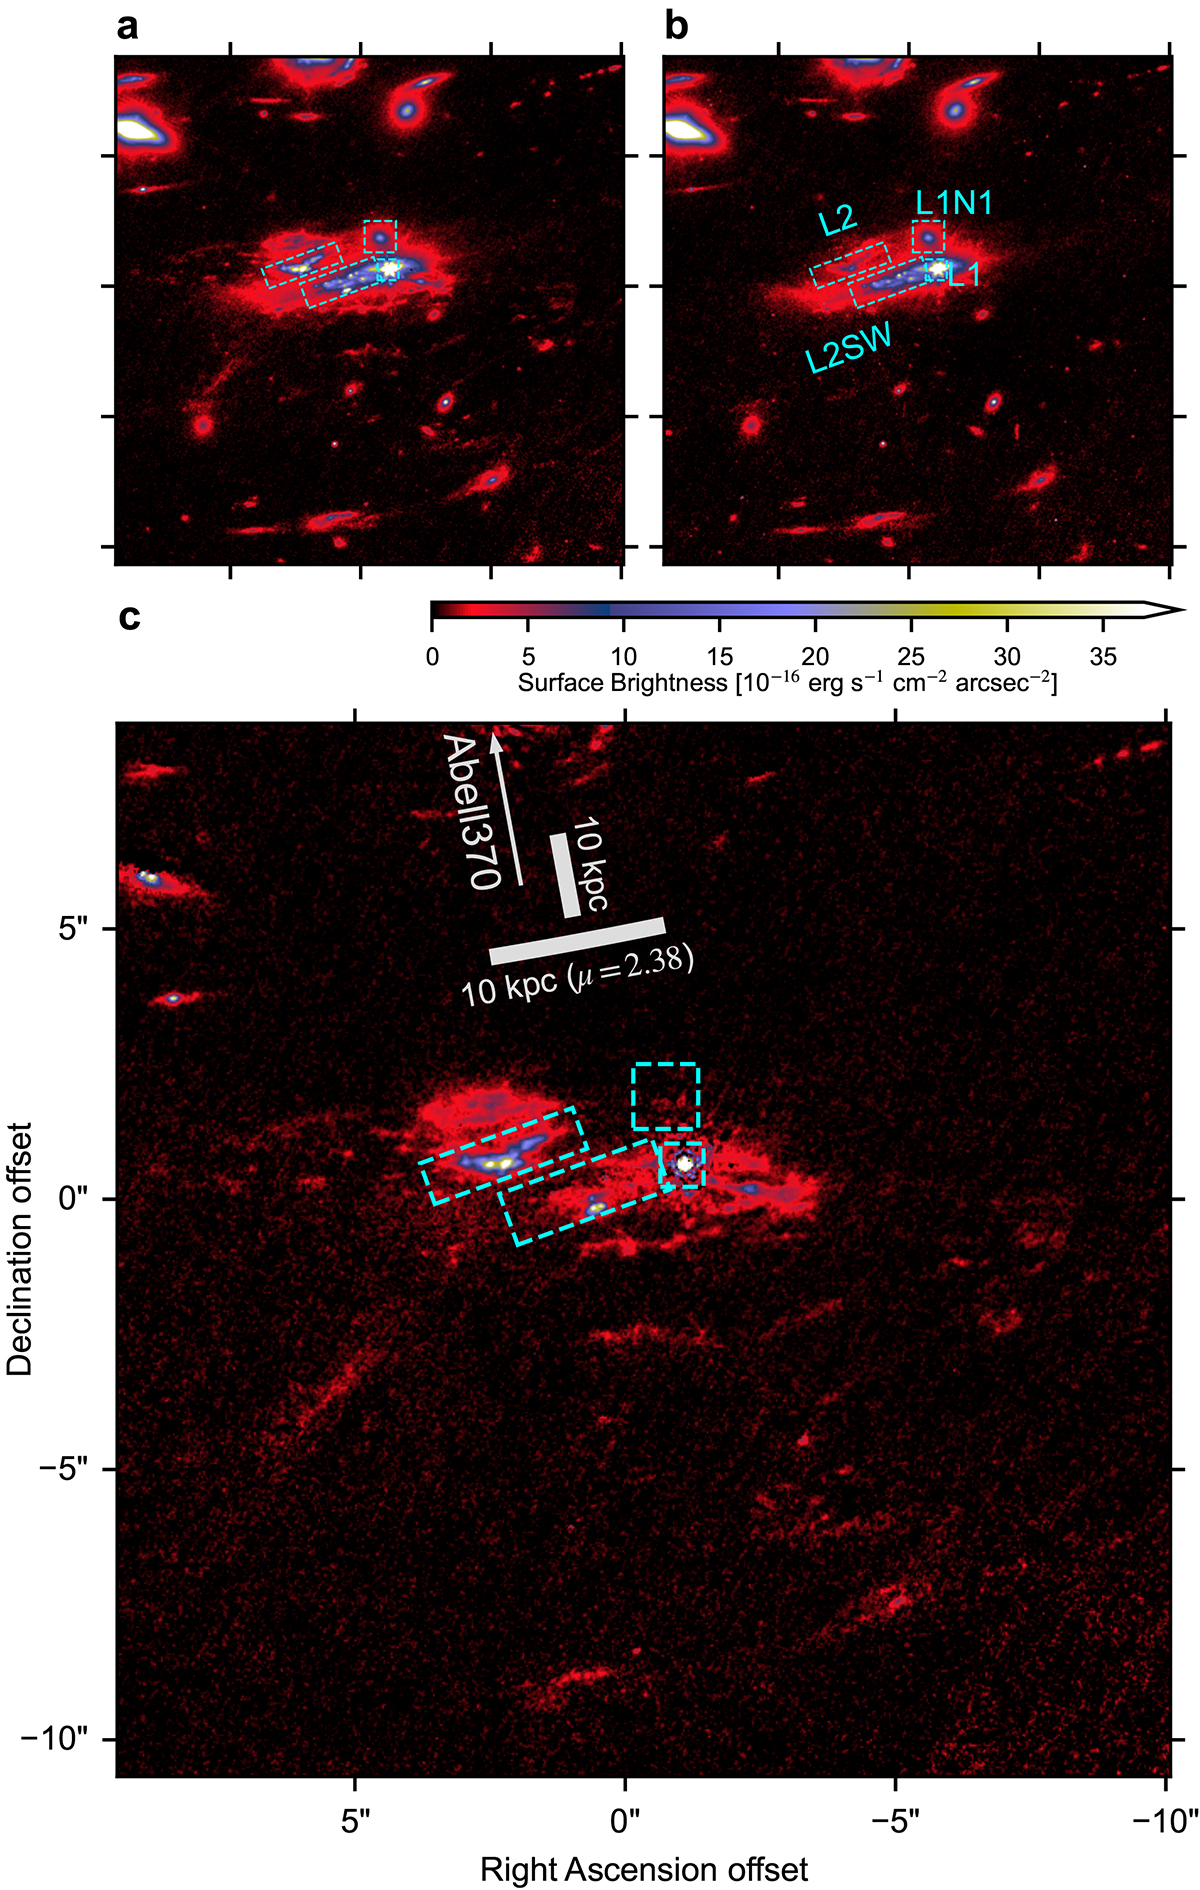
20″ × 20″ postage stamps of the SMM J02399−0136 system a, the JWST/NIRCam F182M image covering the [O III] emission. b, the interpolated stellar continuum based on the adjacent F150W and F210M images. c, the [O III] line emission map produced by subtracting b from a. Various continuum sources of the system identified in the previous studies are marked by the dashed cyan boxes. The grey arrow points towards the center of the gravitational lensing potential of Abell 370 (Richard et al. 2010; Gledhill et al. 2024), and the two grey scale bars show 10 kpc in the physical scale orthogonal to and along the lensing shear.
Current usage metrics show cumulative count of Article Views (full-text article views including HTML views, PDF and ePub downloads, according to the available data) and Abstracts Views on Vision4Press platform.
Data correspond to usage on the plateform after 2015. The current usage metrics is available 48-96 hours after online publication and is updated daily on week days.
Initial download of the metrics may take a while.