Fig. 8
Download original image
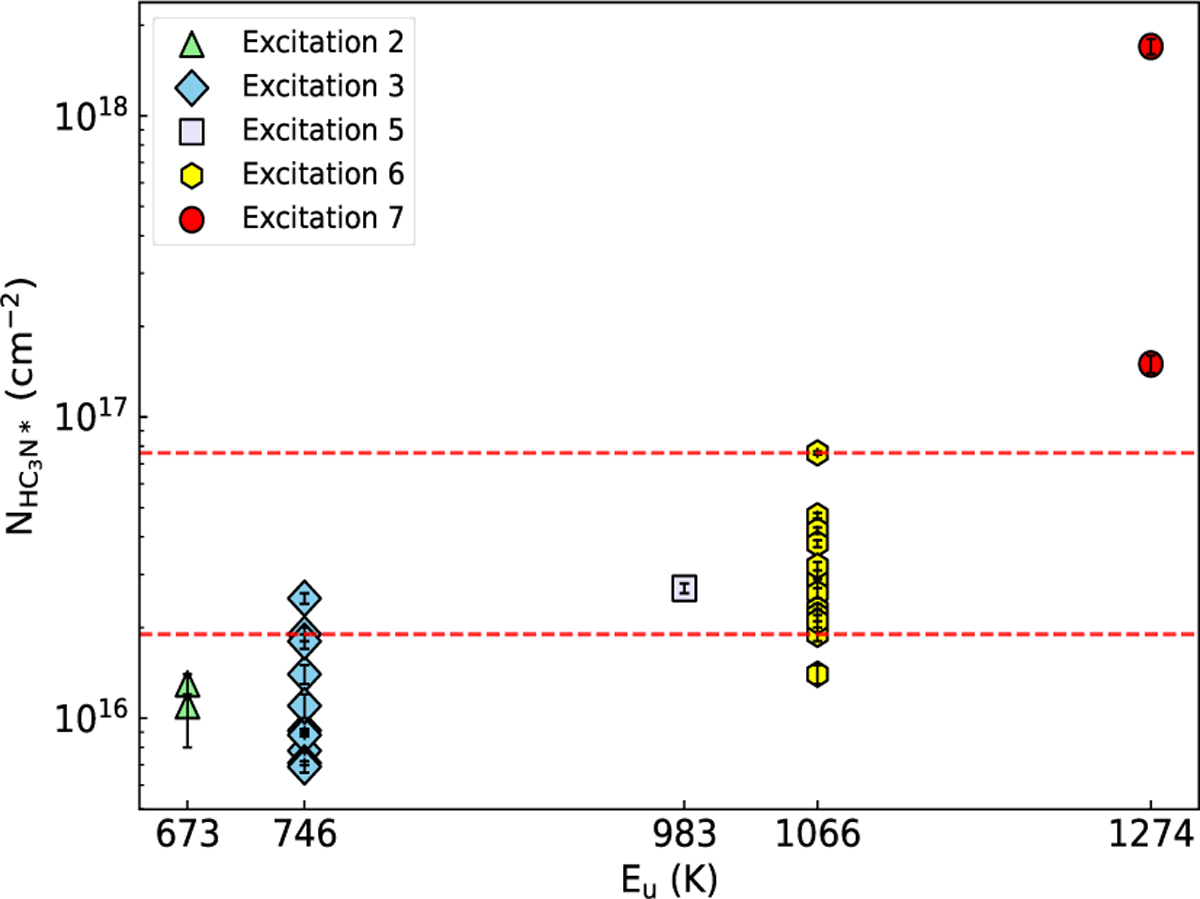
Scatter plot of the distribution of the HC3N* column density as a function of upper level energy. The different markers represent different types of hot cores with different numbers of HC3N* emission lines. The two horizontal dashed red lines represent the two distinguishing values for the column density of 1.9 × 1016 cm−2 and 7.6 × 1016 cm−2, respectively.
Current usage metrics show cumulative count of Article Views (full-text article views including HTML views, PDF and ePub downloads, according to the available data) and Abstracts Views on Vision4Press platform.
Data correspond to usage on the plateform after 2015. The current usage metrics is available 48-96 hours after online publication and is updated daily on week days.
Initial download of the metrics may take a while.