Fig. 7
Download original image
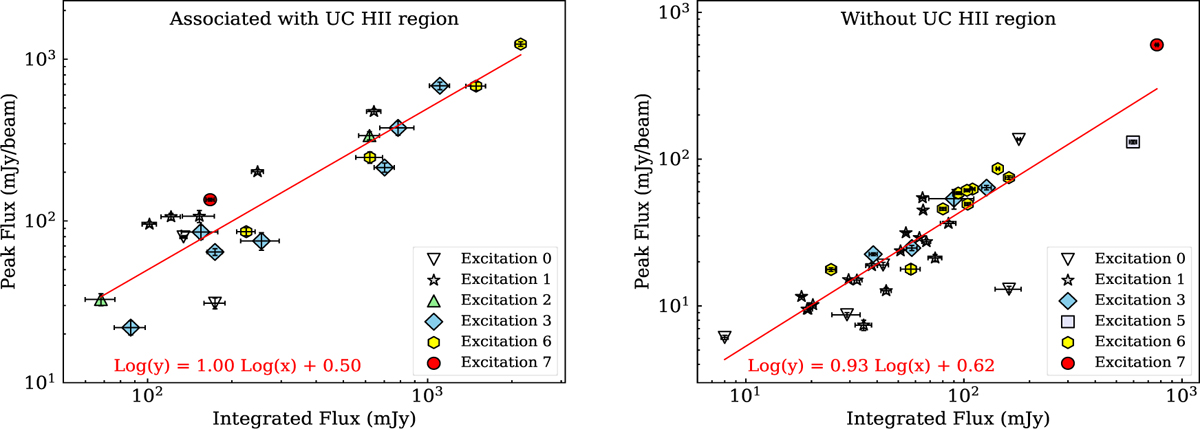
Scatter plot of the peak flux vs. integrated flux for sources associated with UC HII regions (left panel) and for sources without UC HII regions (right panel). The different markers represent different types of hot cores that possess different numbers of HC3N* states. The linear least-squares fit for all dots is shown as the solid red line.
Current usage metrics show cumulative count of Article Views (full-text article views including HTML views, PDF and ePub downloads, according to the available data) and Abstracts Views on Vision4Press platform.
Data correspond to usage on the plateform after 2015. The current usage metrics is available 48-96 hours after online publication and is updated daily on week days.
Initial download of the metrics may take a while.