Fig. 4
Download original image
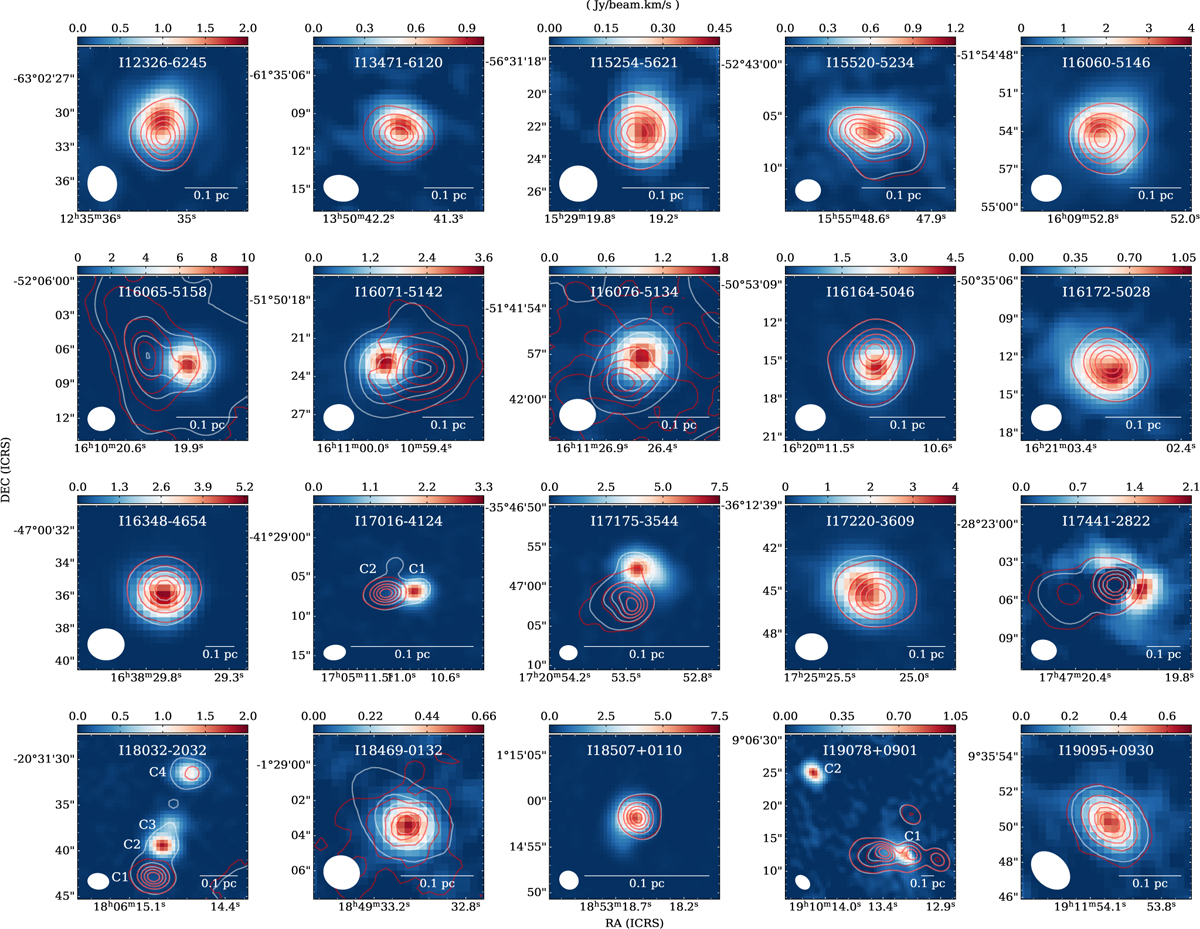
Spatial distributions of HC3N v7 = 1 emission in 20 sources associated with UC HII regions. The background images are moment-0 maps of v7 = 1 emission. The white contours represent the intensity of continuum emission, with contour levels ranging from 10% to 90% of the peak values in steps of 20%. The red contours represent the intensity of UC HII regions (traced by H40α emission), also with contour levels ranging from 10% to 90% of the peak values in steps of 20%. The corresponding beam sizes are shown in the bottom left corner, and the linear scales are shown in the bottom right corner of the image of each source.
Current usage metrics show cumulative count of Article Views (full-text article views including HTML views, PDF and ePub downloads, according to the available data) and Abstracts Views on Vision4Press platform.
Data correspond to usage on the plateform after 2015. The current usage metrics is available 48-96 hours after online publication and is updated daily on week days.
Initial download of the metrics may take a while.