Fig. 3
Download original image
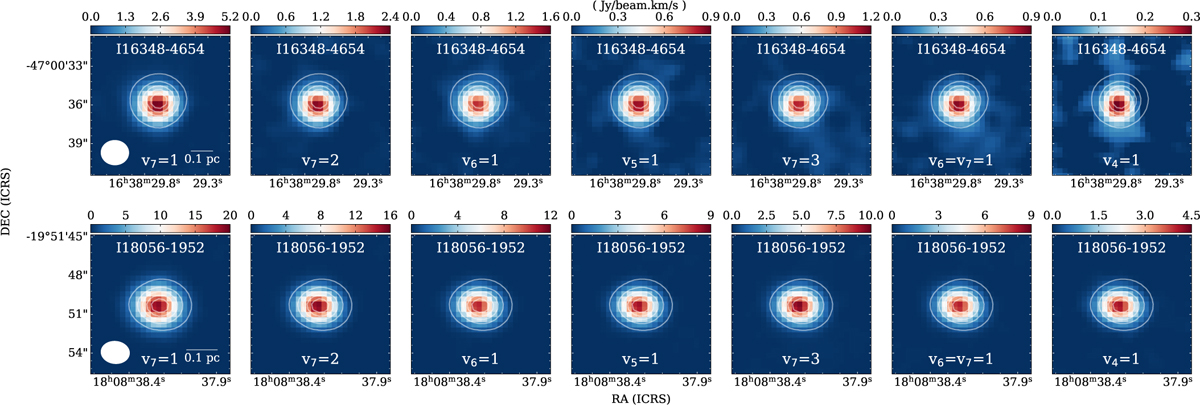
Spatial distribution of 7 HC3N* lines of hot cores in IRAS 16348-4654 (top row) and IRAS 18056-1952 (bottom row). The background image of each panel from left to right is the moment-0 map of the (a) v7 = 1, Eu = 349.77530 K, (b) v7 = 2, Eu = 670.68918 & 673.96249 & 673.96308 K, (c) v6 = 1, Eu = 746.53960 K, Eu = 1065.29153 & 1066.4191 K, (d) v5 = 1 Eu = 983.03920 K, (e) v7 = 3, Eu = 990.39731 K, (f) v6 = v7 = 1, and (g) v4 = 1, Eu = 1274.35207 K emission. The white contours represent the intensity of the continuum emission, with contour levels ranging from 10% to 90% of the peak values in steps of 20%. The corresponding beam sizes are shown in the bottom left corner, and the linear scales are shown in the bottom right corner of the first image of each panel.
Current usage metrics show cumulative count of Article Views (full-text article views including HTML views, PDF and ePub downloads, according to the available data) and Abstracts Views on Vision4Press platform.
Data correspond to usage on the plateform after 2015. The current usage metrics is available 48-96 hours after online publication and is updated daily on week days.
Initial download of the metrics may take a while.