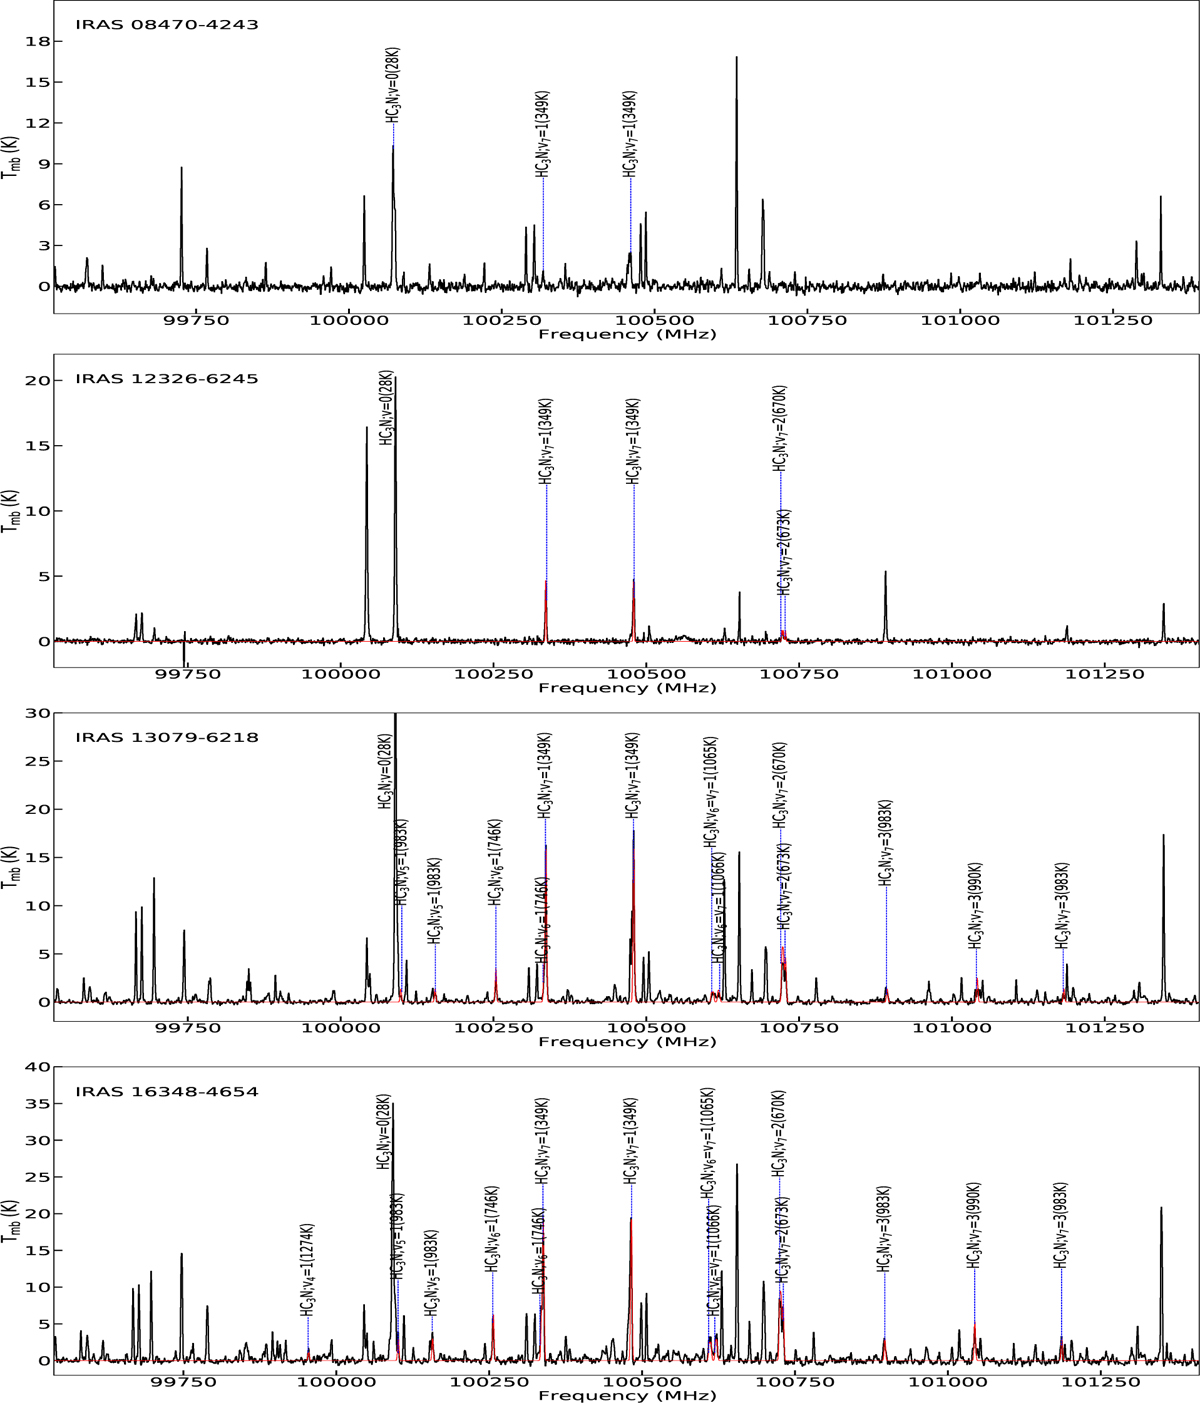
Fig. 1
Download original image
Sample spectra of HC3N* in SPW 8 for four typical hot cores. The black lines show the observed spectra at sky frequencies, and the red lines show the XCLASS modeled spectra using the best-fit parameters for vibrationally excited HC3N lines. The complete spectra in SPW 8 for other hot cores are available in Appendix D (on Zenodo).
Current usage metrics show cumulative count of Article Views (full-text article views including HTML views, PDF and ePub downloads, according to the available data) and Abstracts Views on Vision4Press platform.
Data correspond to usage on the plateform after 2015. The current usage metrics is available 48-96 hours after online publication and is updated daily on week days.
Initial download of the metrics may take a while.