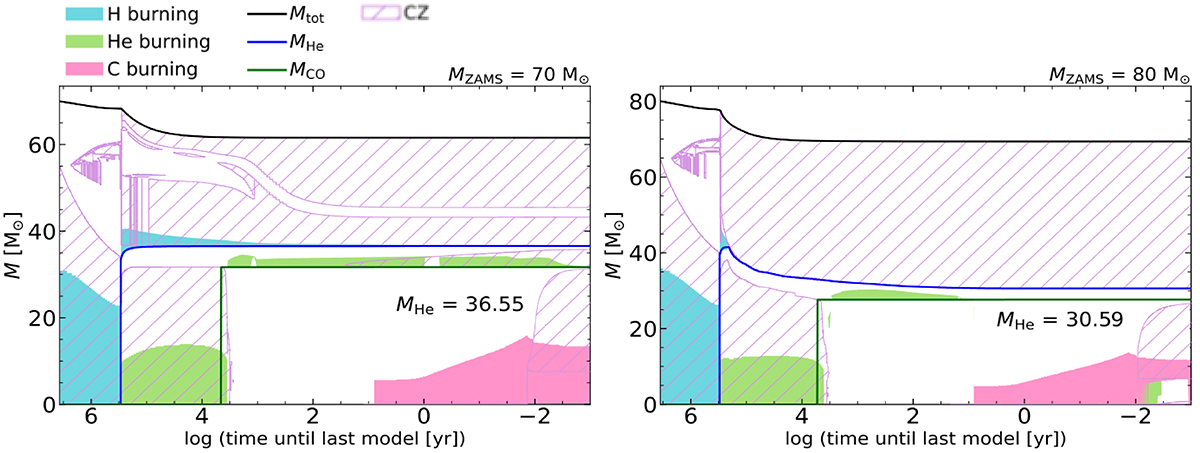
Fig. C.1.
Download original image
Kippenhahn diagrams for MZAMS = 70 M⊙ (left) and MZAMS = 80 M⊙ (right) with Z = 0.001. The Convective zones are indicated by purple hashed lines, and vertical purple lines indicate adjacent convective regions. Burning zones of H, He, and C are indicated by solid-shaded blue, green, and pink regions, respectively. The He core and CO core masses are represented by blue and green lines, respectively.
Current usage metrics show cumulative count of Article Views (full-text article views including HTML views, PDF and ePub downloads, according to the available data) and Abstracts Views on Vision4Press platform.
Data correspond to usage on the plateform after 2015. The current usage metrics is available 48-96 hours after online publication and is updated daily on week days.
Initial download of the metrics may take a while.